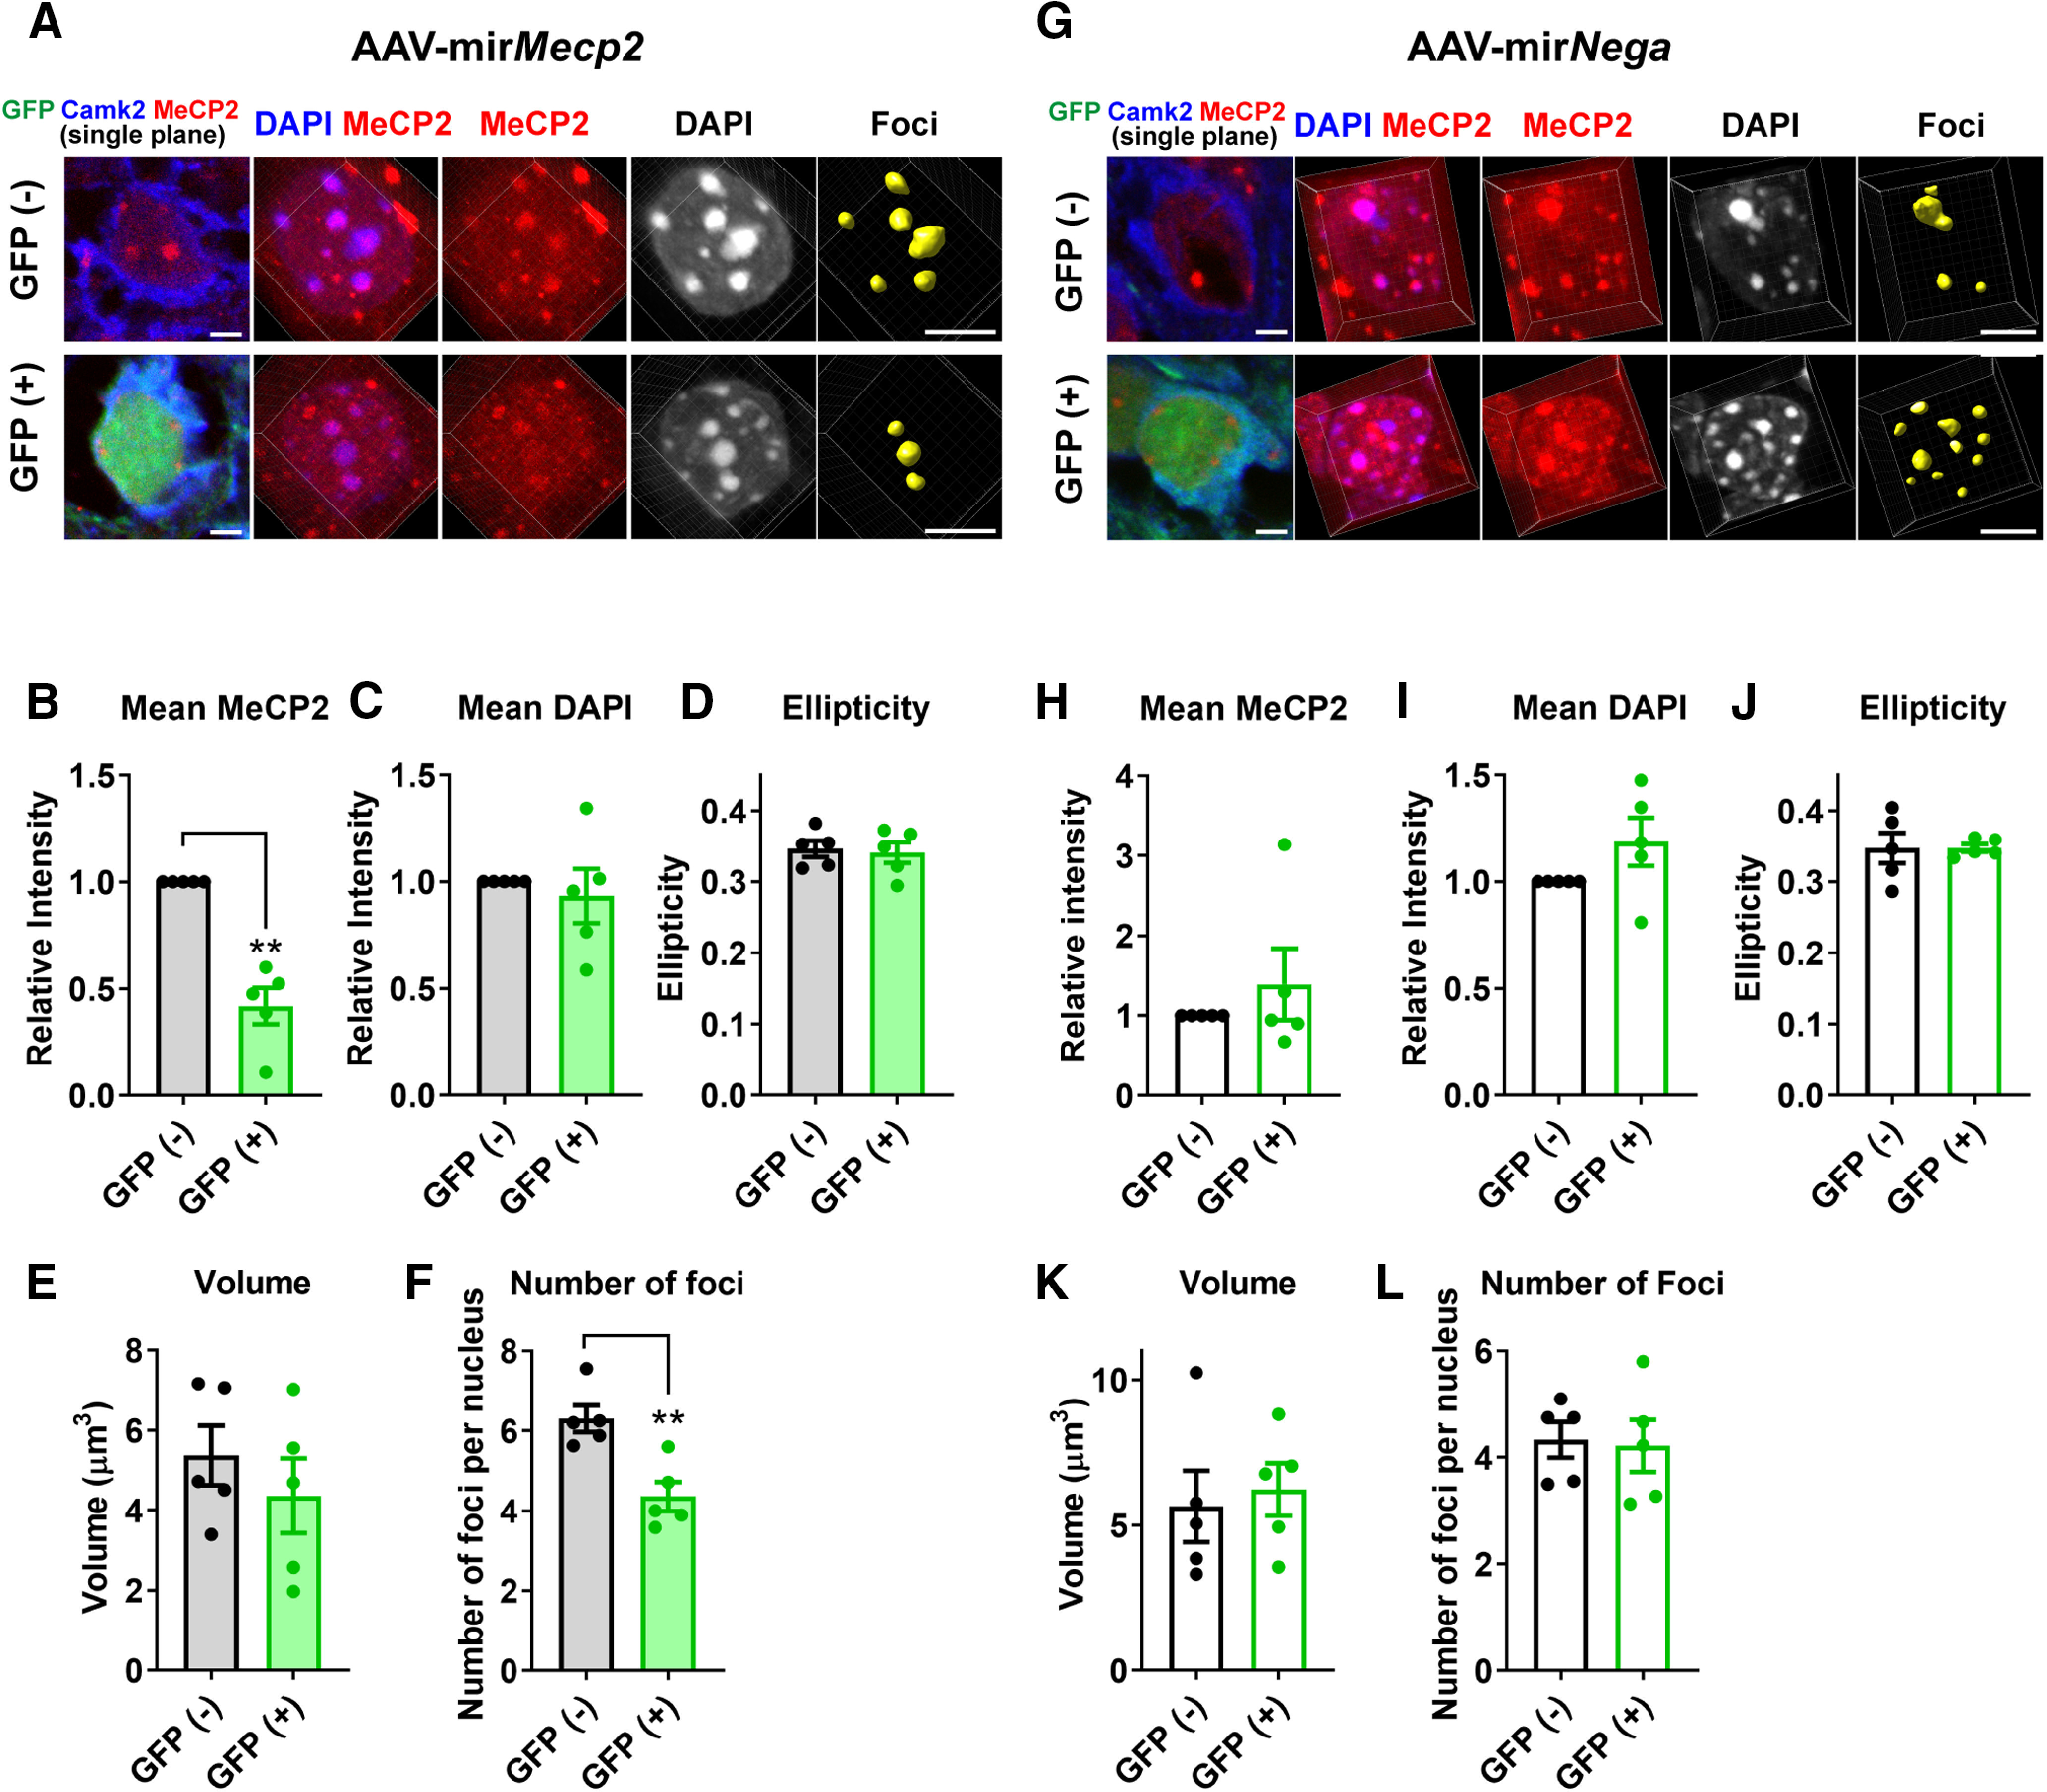
Figure 9.

Knock-down of MeCP2 in the adult cortical pyramidal cells induces reduction in the number of heterochromatic foci. A, AAV(DJ)-vector inducing expression of Mecp2-targetting miRNA and GFP (AAV-mirMecp2) was injected into the PFC of WT mice (six to seven weeks). The mice were perfused five weeks after the injection, and the brain slices were stained with DAPI and antibodies for MeCP2, GFP, and Camk2α to mark pyramidal cells. Images are single plane images showing GFP and Camk2α signals (left panel) and 3D-reconstructed images from the same cells (right panels). Scale bars: 5 µm. B–F, Results from the quantitative analysis of DAPI foci. Reduction of MeCP2 was confirmed in GFP-positive cells (B, p = 0.0024, t(4) = 6.815). Average number of foci within the nucleus was decreased by Mecp2 knock-down (F, p = 0.0085, t(4) = 4.832). No changes were detected in the mean DAPI intensity (C, p = 0.6623, t(4) = 0.4708), ellipticity (D, p = 0.6471, t(4) = 0.4942), or volume (E, p = 0.1037, t(4) = 2.099). Paired t test. N = 5 injected area from 3 mice. G, AAV(DJ)-vector inducing expression of random sequence miRNA and GFP (AAV-mirNega) was injected into the PFC of WT mice (six to seven weeks), and the analysis was done in the same way as in A–F. H–L, Results from the quantitative analysis of DAPI foci. No change was detected in MeCP2 intensity (H, p = 0.6486, t(4) = 0.4919), DAPI intensity (I, p = 0.1705, t(4) = 1.669), ellipticity (J, p = 0.99, t(4) = 0.00018), number of foci (K, p = 0.8717, t(4) = 0.1722), or volume (L, p = 0.7768, t(4) = 0.3717). Paired t test. N = 5 injected area from 3 mice. Bar graphs show average ± SEM; **p < 0.01.
