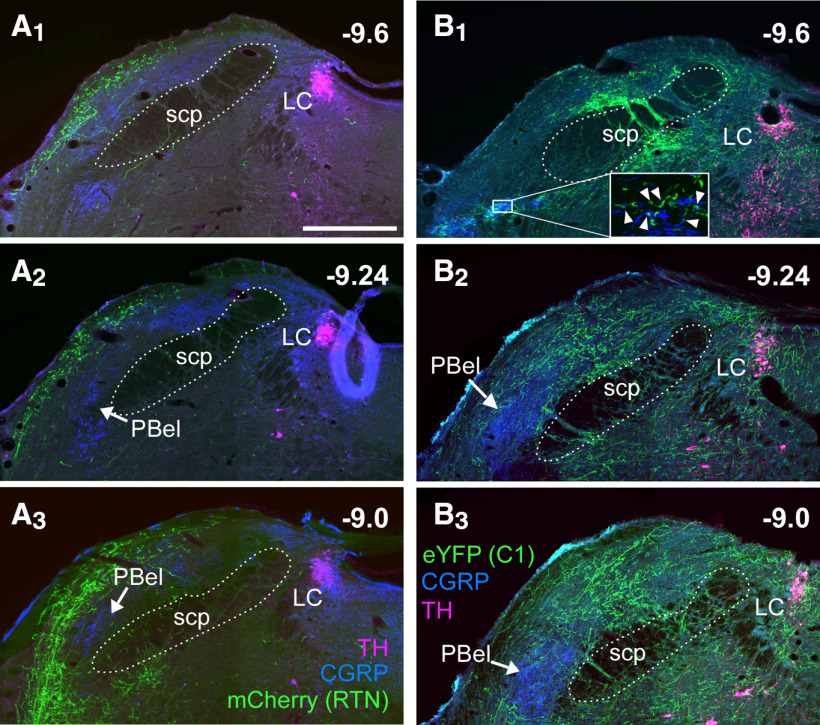
Figure 10.
Projections of RTN and C1 neurons to the PB and LC. A1-A3, Coronal sections at three rostrocaudal levels showing the projections of RTN neurons expressing mCherry (fibers in green). The PBel is identified by the presence of CGRP immunoreactivity (blue). Magenta represents TH. B1-B3, Coronal sections at three rostrocaudal levels showing the projection of C1 neurons (eYFP+ fibers, in green) to the PB. Blue represents CGRP. Magenta represents TH. Note the overlap between C1 fibers and CGRP processes in the caudal portion of PBel (B1, boxed area and magnified inset; arrowheads) and the dense innervation to LC.

