Figure 2.
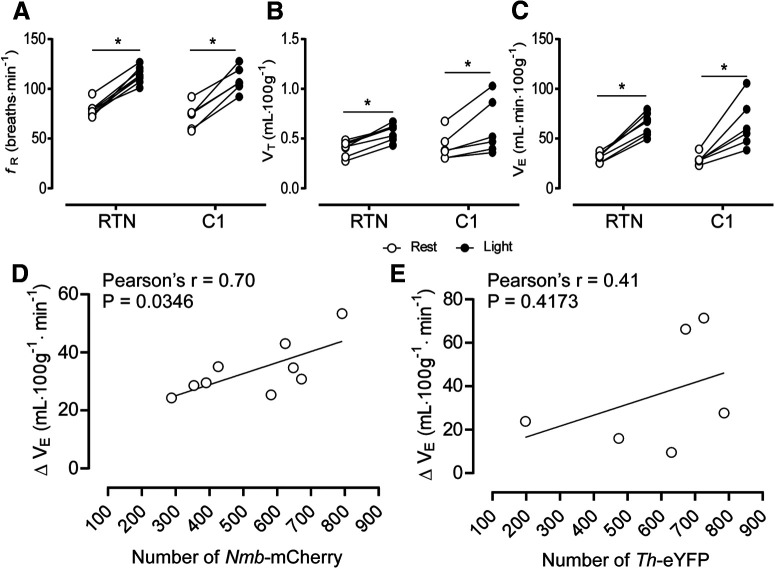
Selective stimulation of RTN or C1 neurons activates breathing to a comparable degree. A, Changes in fR produced by photostimulation of RTN or C1 neurons. Two-way ANOVA for repeated measures: interaction between cell type and stimulation, F(1,12) = 0.093, p = 0.764; effect of cell type, F(1,12) =1.40, p = 0.258; effect of stimulation, F(1,12) = 216.9, p < 0.0001. B, Change in VT produced by stimulation of RTN or C1 neurons. Two-way ANOVA for repeated measures: interaction between cell type and stimulation, F(1,12) = 0.18, p = 0.6754; effect of cell type, F(1,12) = 0.086, p = 0.7732; effect of stimulation, F(1,12) = 40.54, p < 0.0001. C, Changes in VE produced by stimulation of RTN or C1 neurons. Two-way ANOVA for repeated measures: interaction between cell type and stimulation, F(1,3) = 0.093, p = 0.7799; effect of cell type, F(1,7) = 0.052, p = 0.8252; effect of stimulation, F(1,7) = 63.33, p < 0.0001. D, Correlation between number of RTN neurons (Nmb+ChR2-mCherry) and changes in VE produced by photostimulation. E, Correlation between number of C1 neurons (Th+ChR2-mCherry) and changes in VE produced by photostimulation. *p < 0.05 (Bonferroni's multiple comparisons).

