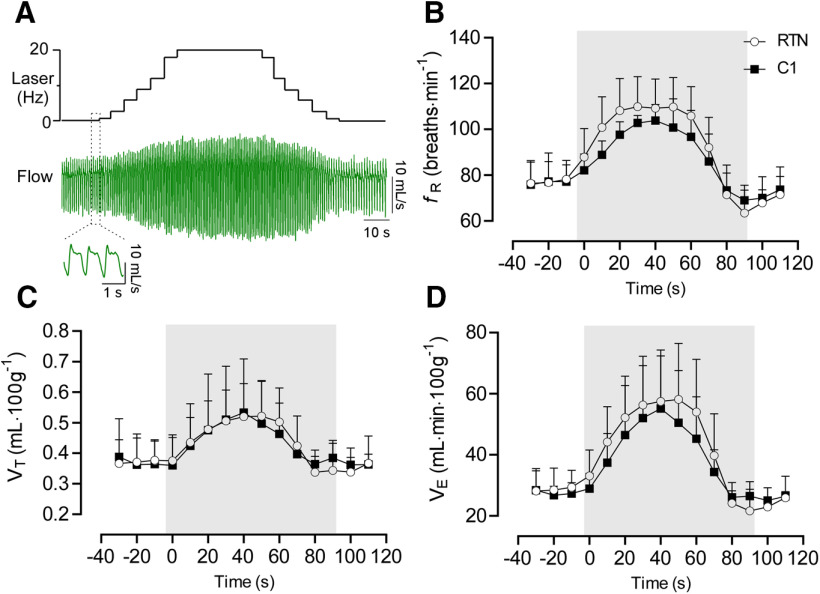
Figure 7.
Respiratory changes during incrementing-decrementing stimulation of RTN (n = 8) or C1 (n = 6). A, Respiratory flow during RTN or C1 stimulation. This pattern of stimulation produces a smooth increase in the respiratory variables mimicking the pattern of breathing during acute CO2 or hypoxia exposure (Souza et al., 2019). B, Average values from fR incrementing-decrementing stimulation. Two-way ANOVA for repeated measures: interaction between cell type and time, F(14,168) = 1.07, p = 0.3866; effect of time, F(2.85,34.3) = 56.6, p < 0.0001; effect of cell type, F(1,12) = 1.54, p = 0.2337. C, VT. Two-way ANOVA for repeated measures: interaction between cell type and time, F(14,168) = 0.70, p = 0.7671; effect of time, F(2.3,27.9) = 23.3, p < 0.0001; effect of cell type, F(1,12) = 0.43, p = 0.5236. D, VE. Two-way ANOVA for repeated measures: interaction between cell type and time, F(14,168) = 0.68, p = 0.7825; effect of time, F(1.3,15.6) = 52.7, p < 0.0001; effect of cell type, F(1,12) = 0.008, p = 0.9266.

