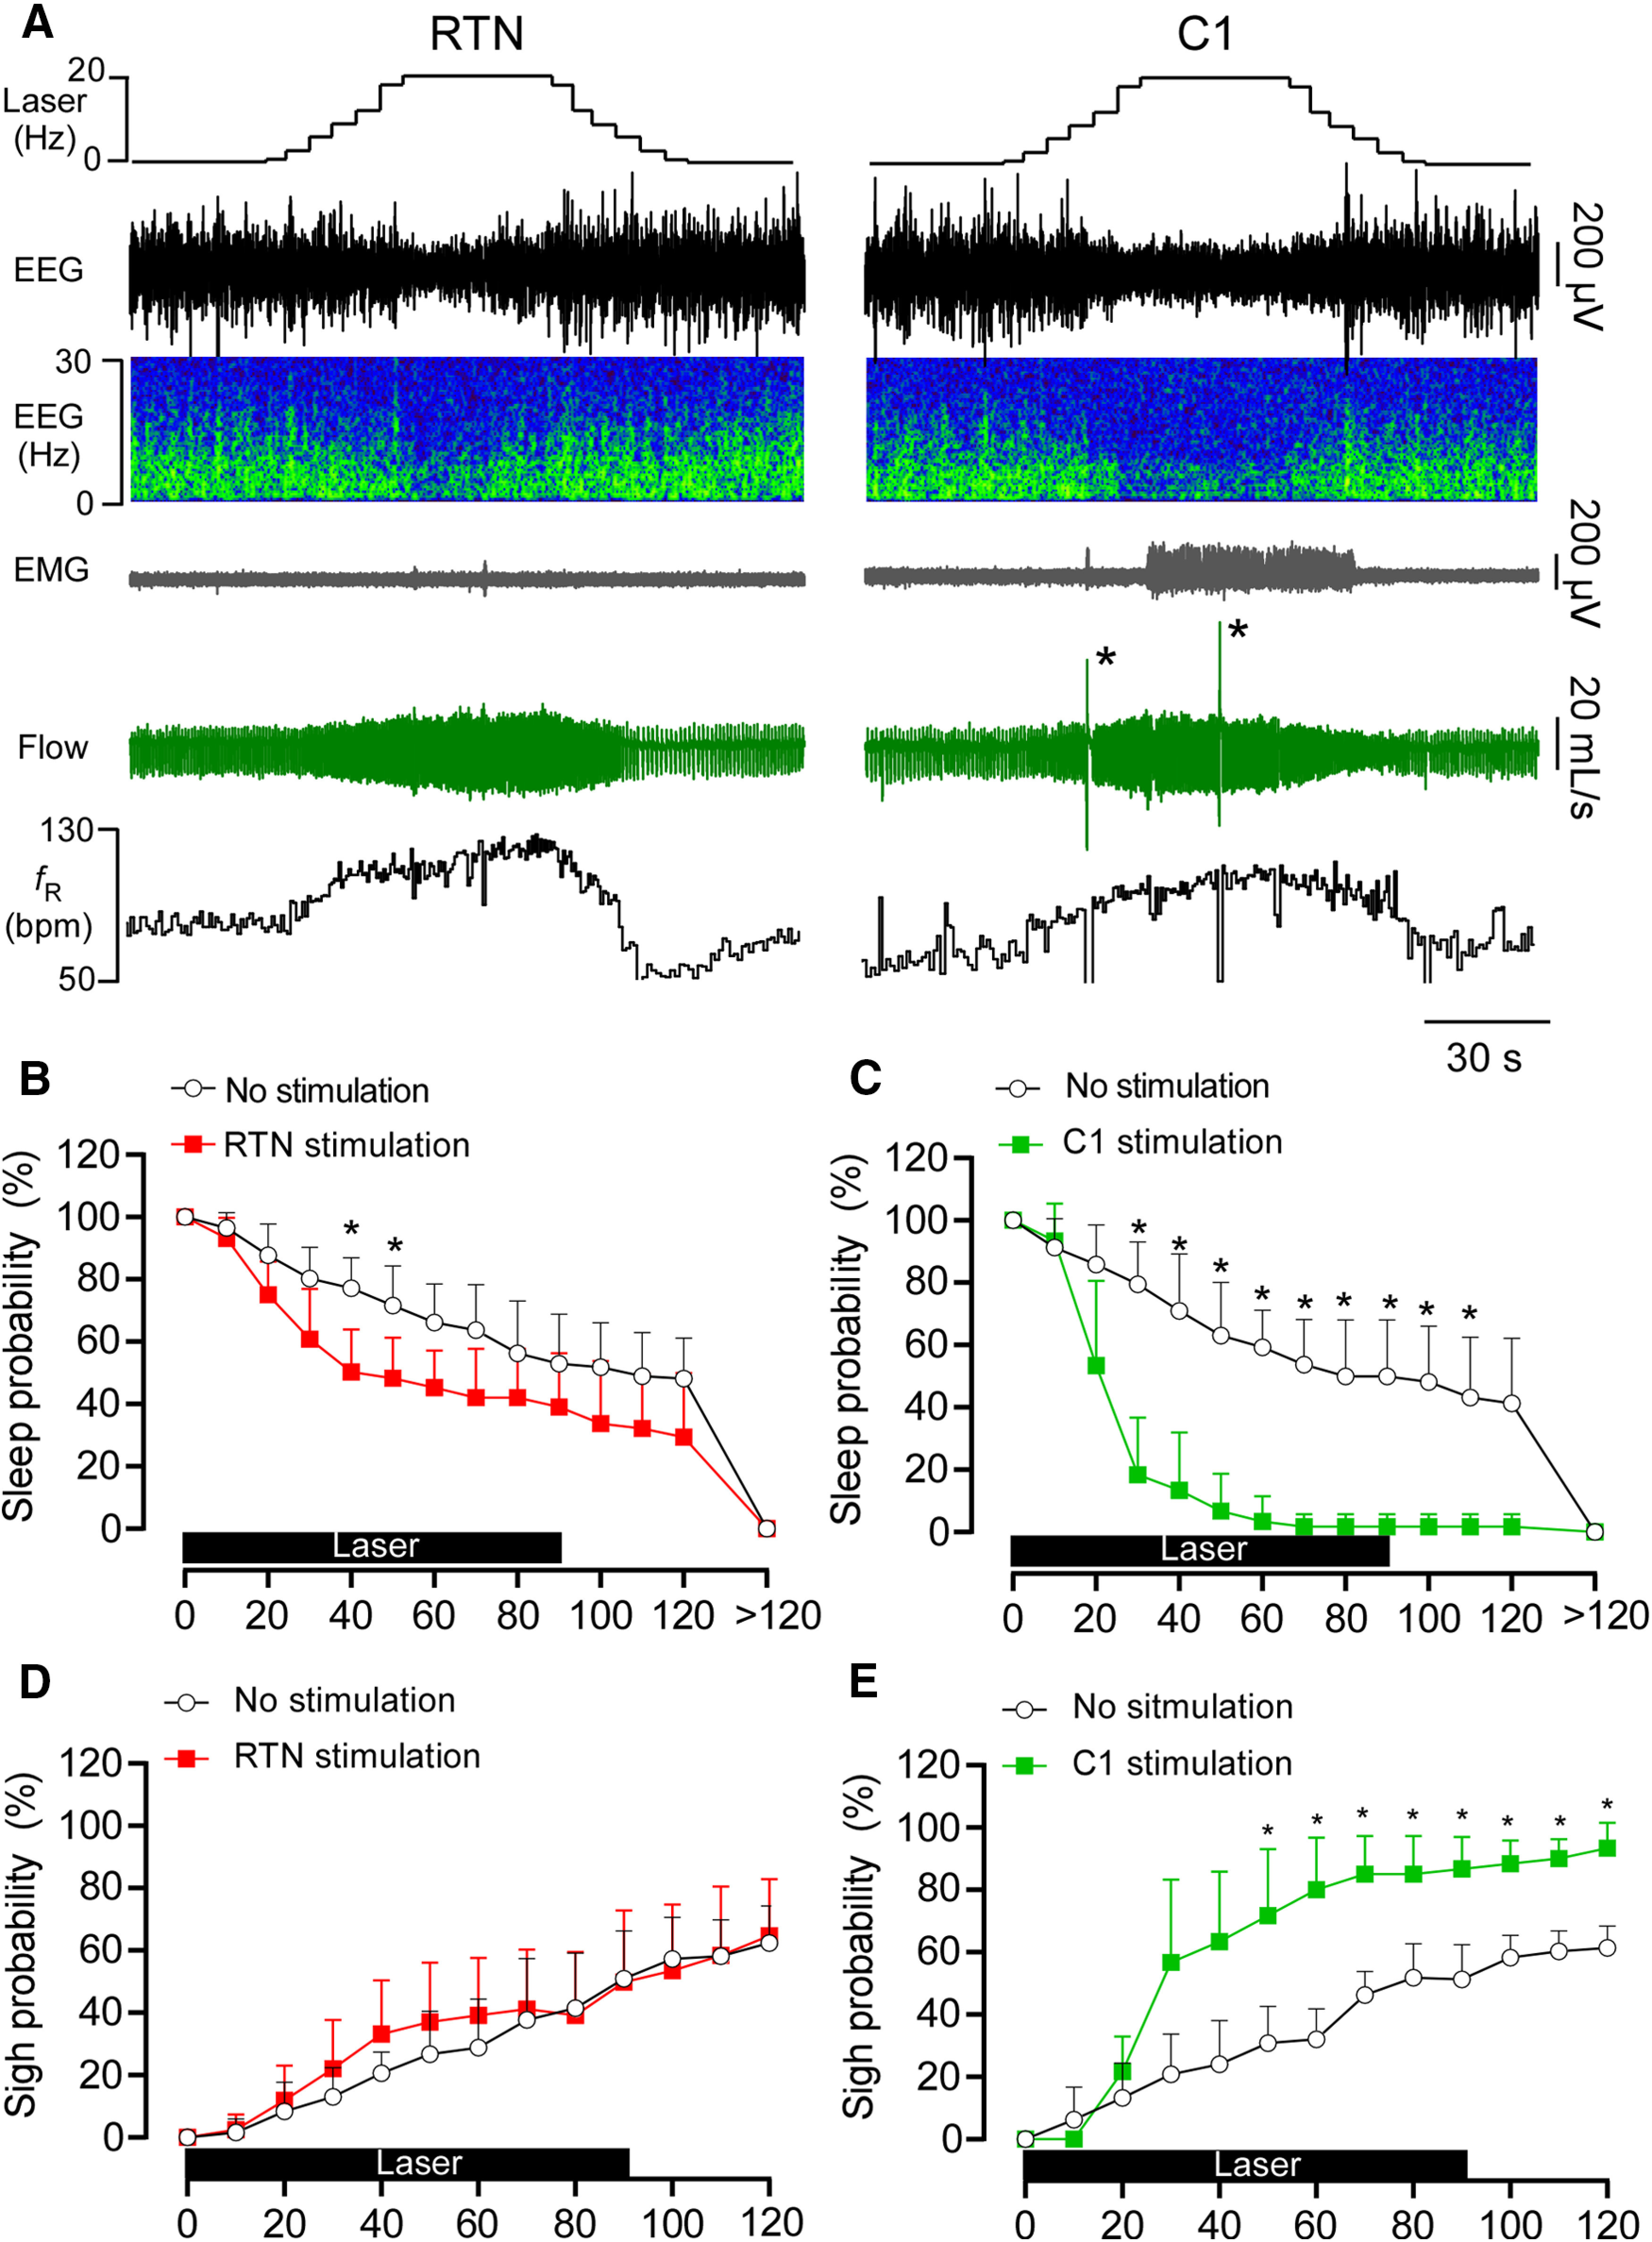
Figure 8.

RTN or C1 stimulation causes arousal from sleep. A, EEG, neck EMG, and breathing during augmenting RTN and C1 stimulation. Note the period of arousal in both examples denoted by EEG desynchronization. Also, the period of wakefulness is longer following C1 stimulation than RTN stimulation, and C1 but not RTN stimulation results in sighs (asterisks). B, Sleep probability curves during RTN stimulation (n = 8) or dummy stimulation (representing the probability of a spontaneous arousal). ANOVA two-way repeated measures: interaction between stimulation and time, F(13,182) = 3.857, p < 0.0001; effect of time, F(2.7,37.7) = 138.4, p < 0.0001; effect of stimulation, F(1,14) = 8.796, p = 0.0102. C, Sleep probability curves during C1 stimulation (n = 6) and dummy stimulation. ANOVA two-way repeated measures: interaction between stimulation and time, F(13,130) = 17.5, p < 0.0001; effect of time, F(3.9,39.4) = 110.6, p < 0.0001; effect of stimulation, F(1,10) = 44.02, p < 0.0001. D, Sigh probability curves during RTN stimulation (n = 8) and dummy stimulation. ANOVA two-way repeated measures: interaction between stimulation and time, F(12,168) = 1.34, p = 0.2014; effect of time, F(2.8,39.9) = 82.2, p < 0.0001; effect of stimulation, F(1,14) = 0.32, p = 0.5796. E, Sigh probability curves during C1 stimulation (n = 6) and dummy stimulation. ANOVA two-way repeated measures: interaction between stimulation and time, F(12,120) = 8.43, p < 0.0001; effect of time, F(3.1,31.7) = 89.8, p < 0.0001; effect of stimulation, F(1,10) = 39.4, p < 0.0001. *p < 0.05 (Bonferroni's multiple comparisons between stimulation and no stimulation in B-E).
