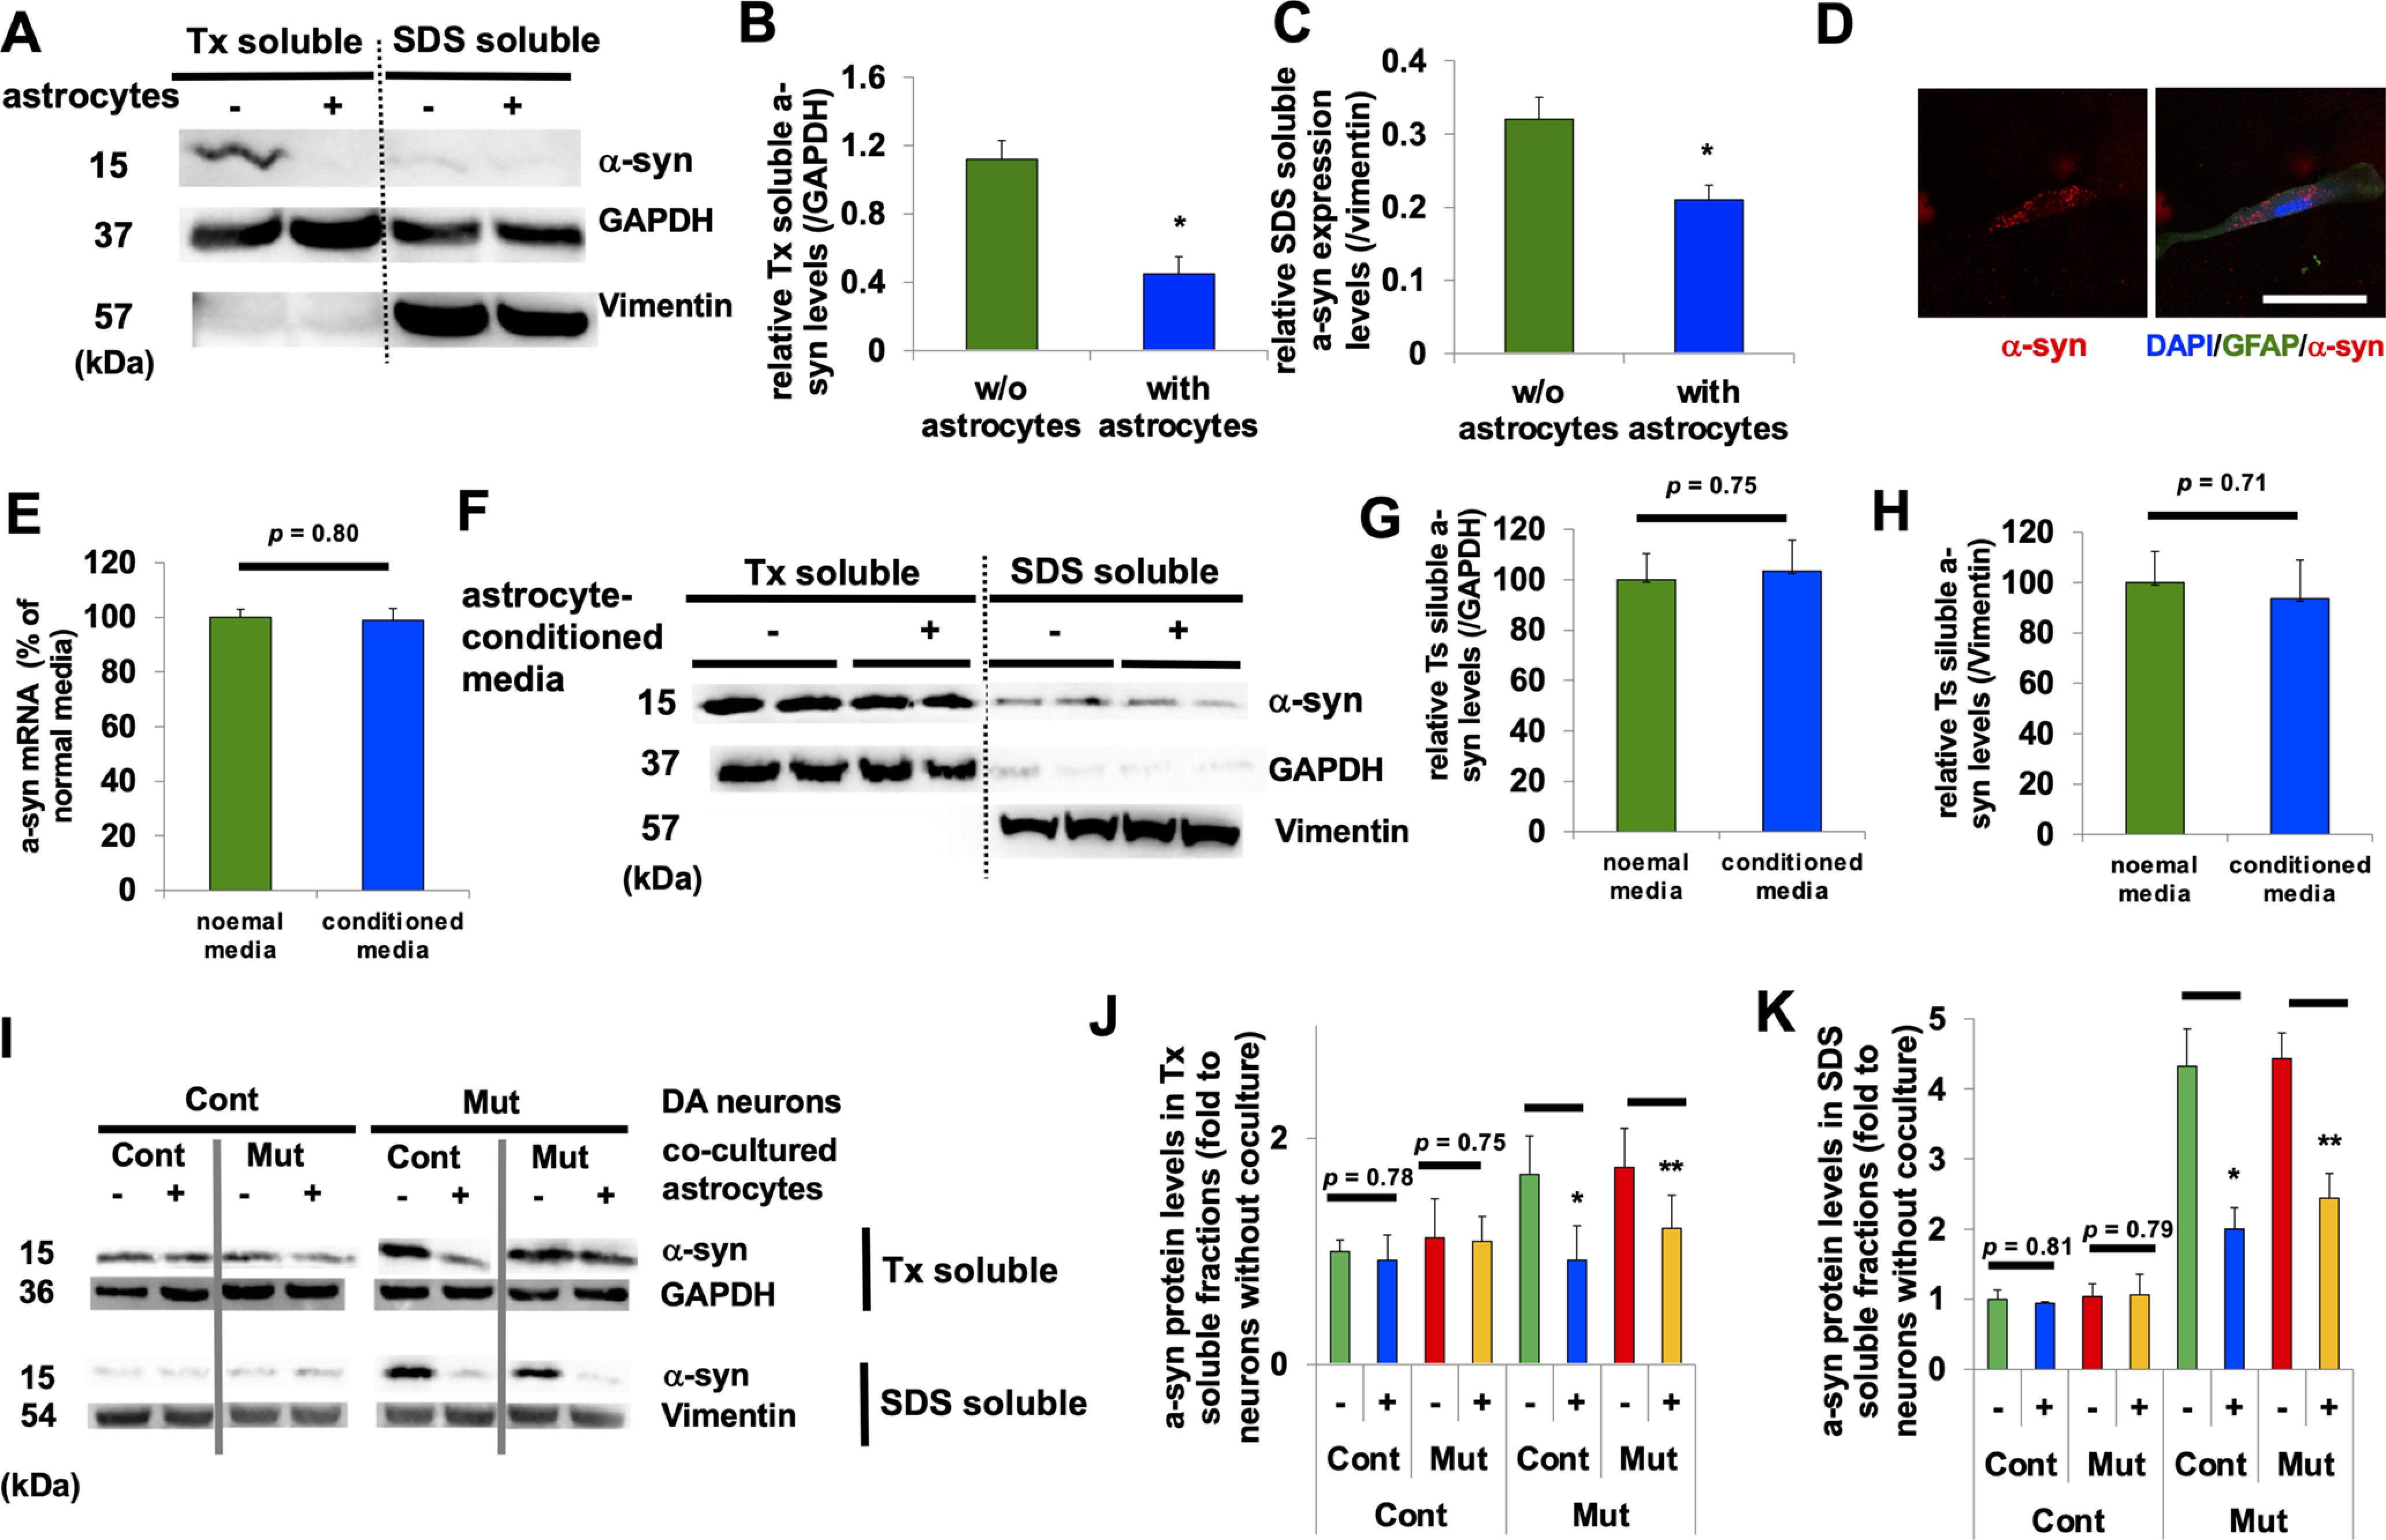
Figure 2.

Coculturing of astrocytes and neurons lowers neuronal levels of α-syn. A, Representative immunoblot for α-syn, GAPDH, and vimentin in Triton-soluble (right two columns) and Sodium dodecyl sulfate (SDS)-soluble fractions (left two columns) from rat primary cortical neurons that were cultured without (each left column) or with (each right column) rat primary astrocytes. B, Densitometric quantification is shown as the relative α-syn levels against GAPDH in Triton-soluble fractions in cortical neurons (n = 3, *p = 0.021, Student's t test). C, Densitometric quantification is shown as the relative α-syn levels against vimentin in SDS-soluble fractions in cortical neurons (n = 3, *p = 0.035, Student's t test). D, A representative image of rat primary neuron that was cocultured with α-syn Alexa Fluor 555-containing astrocytes. E, Expression of α-syn mRNA in rat primary neurons before and after being cultured in astrocyte-conditioned media (n = 3, p = 0.80, Student's t test). F, Representative immunoblot for Triton-soluble (right four columns) and SDS-soluble fractions (left four columns) from rat primary cortical neurons before and after cultured in astrocyte-conditioned media. G, Densitometric quantification is shown as the relative α-syn levels against GAPDH in Triton-soluble fractions in rat primary cortical neurons (n = 3, p = 0.75, Student's t test). H, Densitometric quantification is shown as the relative α-syn levels against vimentin in SDS-soluble fractions in rat primary cortical neurons (n = 3, p = 0.71, Student's t test). I, Representative immunoblot for Triton-soluble fractions (top two lanes) and SDS-soluble fractions (bottom two lanes) from Cont (Cont 1; left four columns) and Mut (ATP13A2 Mut 1; right four columns) DA neurons that were cultured without (left) or with (right) Cont astrocytes. J, Densitometric quantification is shown as the relative α-syn levels against GAPDH in Triton-soluble fractions in DA neurons (n = 3, *p = 0.018, **p = 0.033, Student's t test). K, Densitometric quantification is shown as the relative α-syn levels against vimentin in SDS-soluble fractions in DA neurons (n = 3, *p = 0.005, **p = 0.009, Student's t test). In all graphs, error bars indicate SEM.
