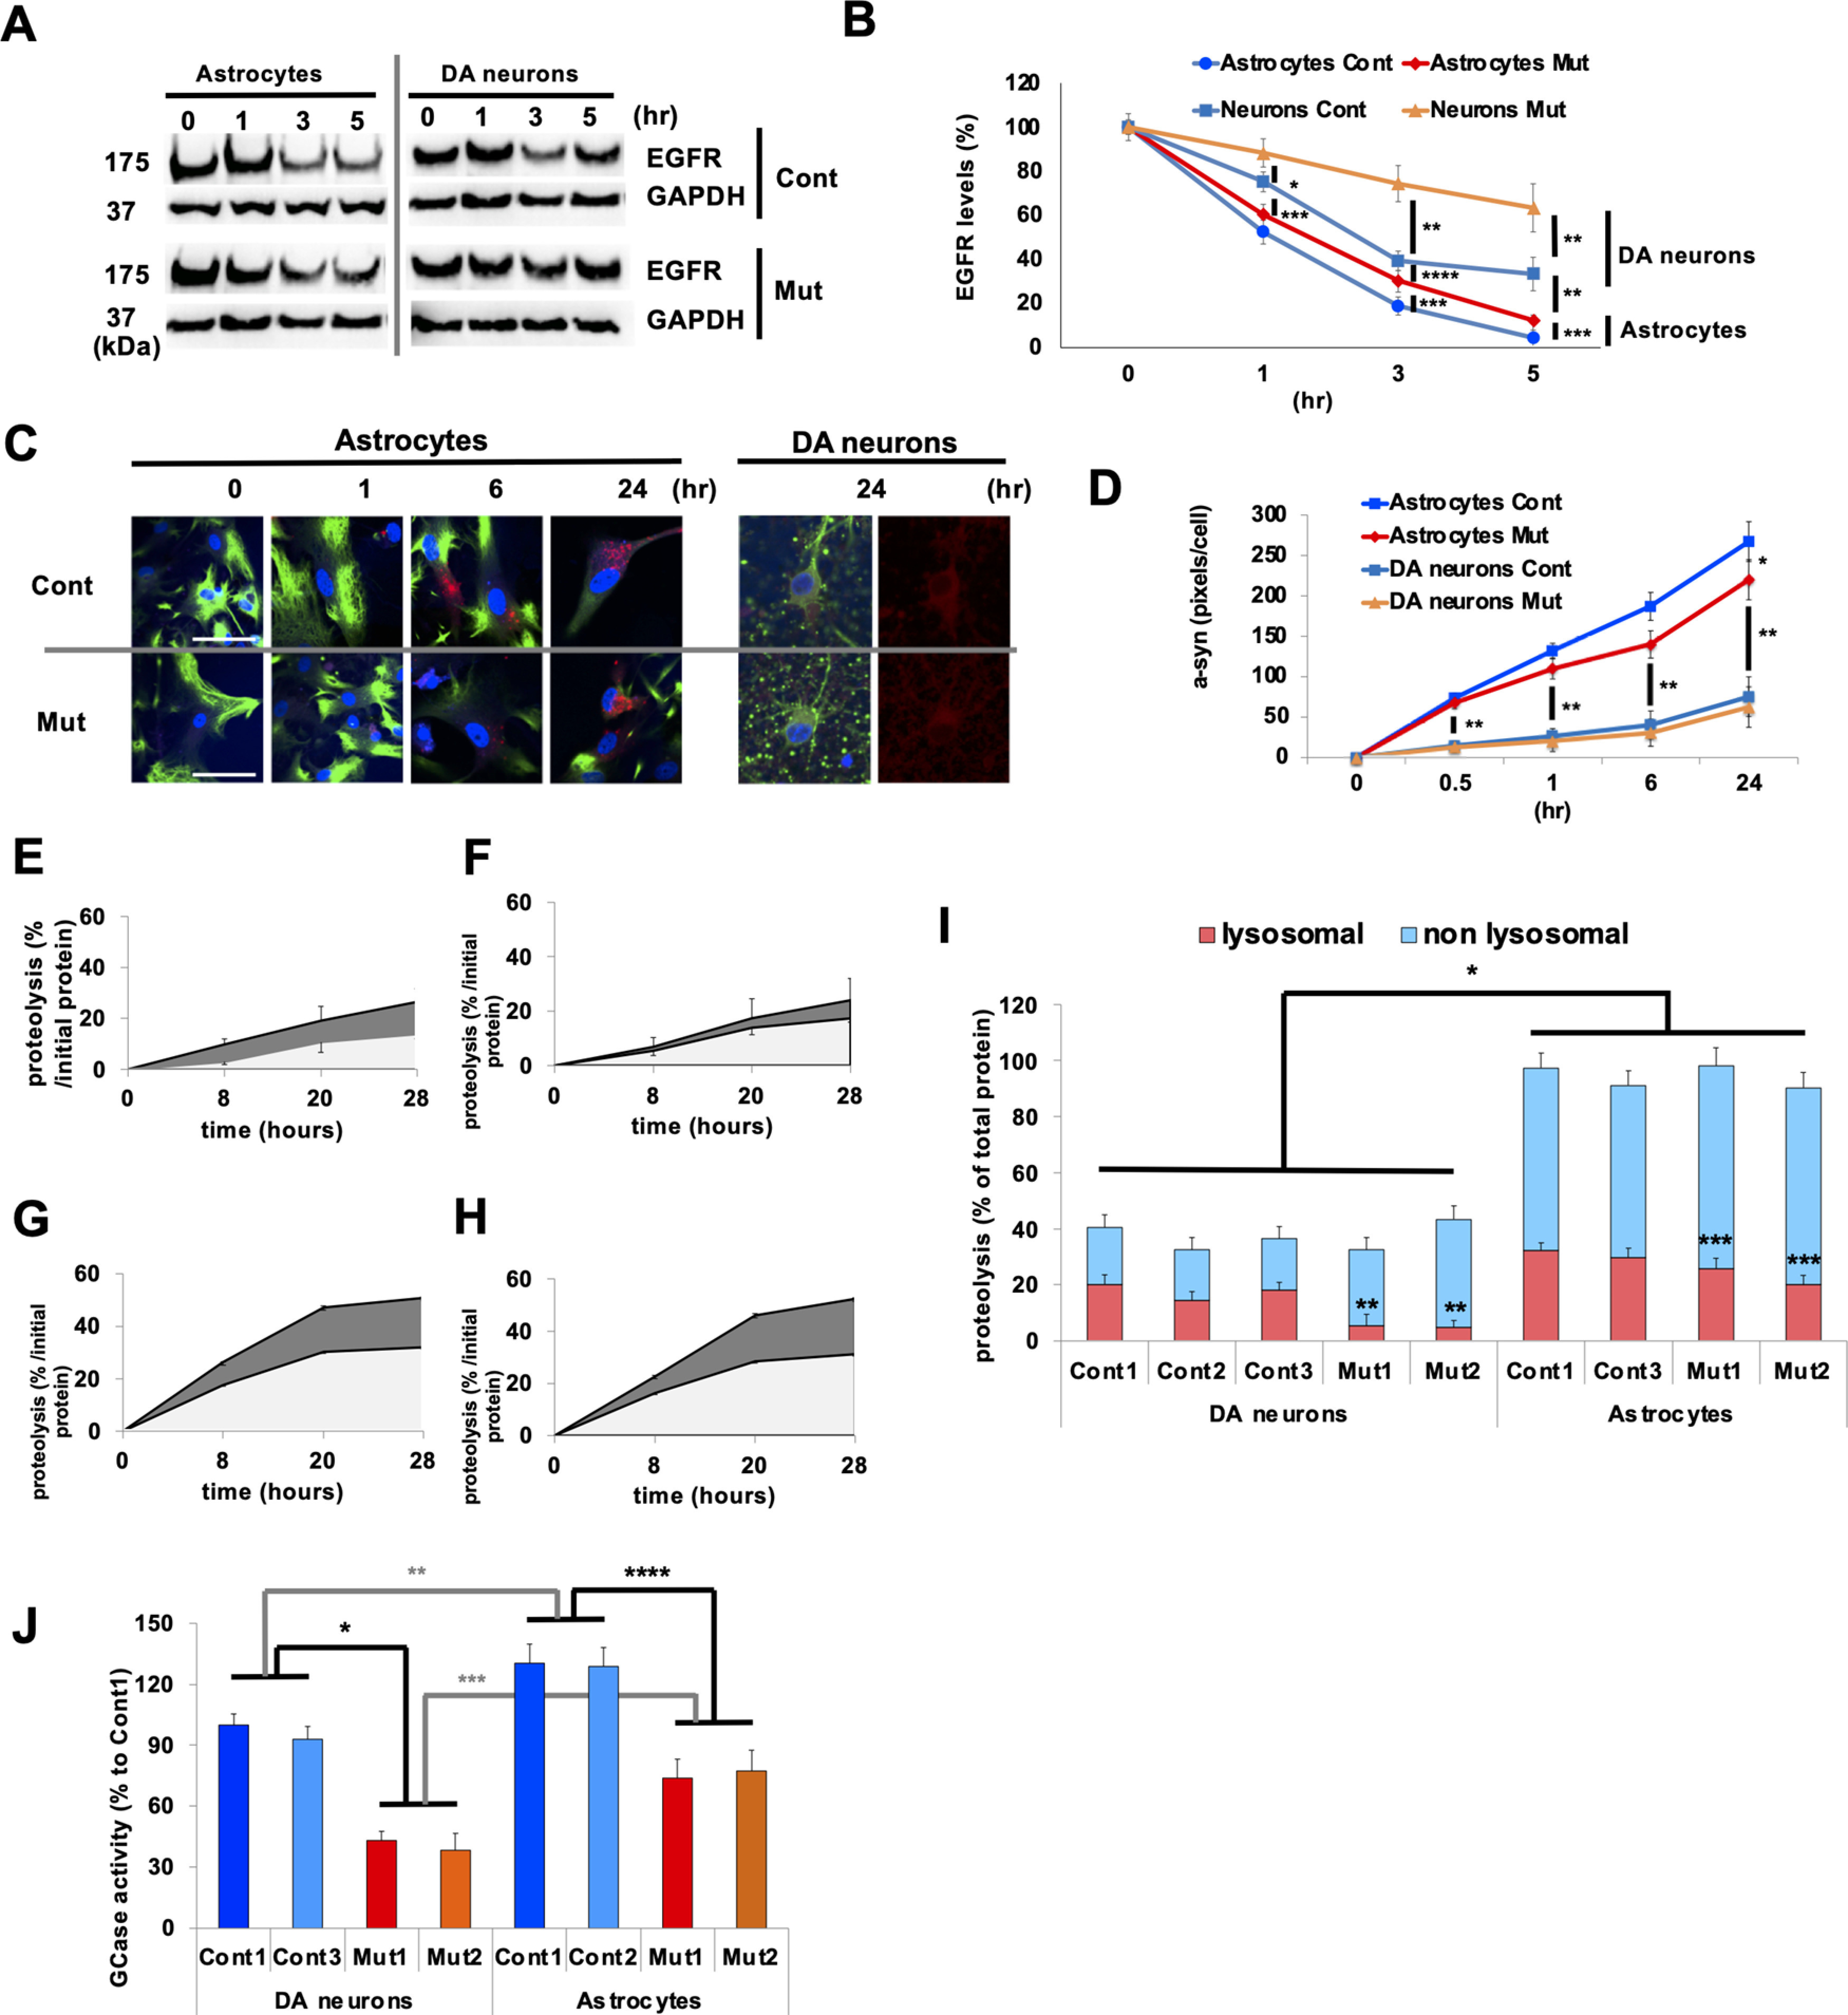
Figure 3.

Astrocytes exhibit higher rates of lysosomal proteolysis compared with neurons. A, Representative immunoblot for EGFR degradation in iPSC-derived Cont (Cont 1) and Mut (Mut 1) astrocytes and Cont and Mut DA neurons that was followed for 5 h. B, Levels of EGFR were normalized to GAPDH levels and expressed as percentage levels of the initial time point (T0; n = 6, *p = 0.037, **p = 0.01, ***p = 0.015, ****p = 0.041, one-way ANOVA with Tukey's post hoc test). C, Representative images of α-syn internalization assay in Cont (Cont 1) and Mut (ATP13A2 Mut1) astrocytes and DA neurons. At 0, 1, 6, and 24 h after incubation with α-syn oligomers/fibrils, the astrocytes and DA neurons were fixed and stained with GFAP with DAPI and b-iii-T with DAPI, respectively. D, Analysis of α-syn internalization assay in astrocytes and DA neurons (n = 3, *p = 0.037, **p = 0.0014, one-way ANOVA with Tukey's post hoc test). E–I, Lysosomal proteolysis of Cont (E) and Mut (F) DA neurons and Cont (G) and Mut (H) astrocytes is calculated by subtracting lysosomal inhibitors (2.5 mm NH4Cl and 50 μm leupeptin) sensitive to proteolysis from total proteolysis at 8, 20, and 28 h after chase. I, Lysosomal (red) and nonlysosomal (light blue) proteolysis in Cont 1–3, Mut 1, and 2 DA neurons (left four columns) and in Cont 1 and 3 and Mut 1 and 2 astrocytes (right four columns; n = 3, *p = 0.009, **p = 0.022, ***p = 0.039, one-way ANOVA with Tukey's post hoc test). J, Glucocerebrosidase (GCase) activities in lysosome-enriched fractions extracted from Cont 1 and 3, Mut 1, and 2 DA neurons (left four columns) and in Cont 1 and 2, Mut 1 and 2 astrocytes (right four columns; n = 3, *p = 0.009, **p = 0.037, ***p = 0.027, ****p = 0.019, one-way ANOVA with Tukey's post hoc test). In all graphs, error bars indicate SEM.
