Figure 5.

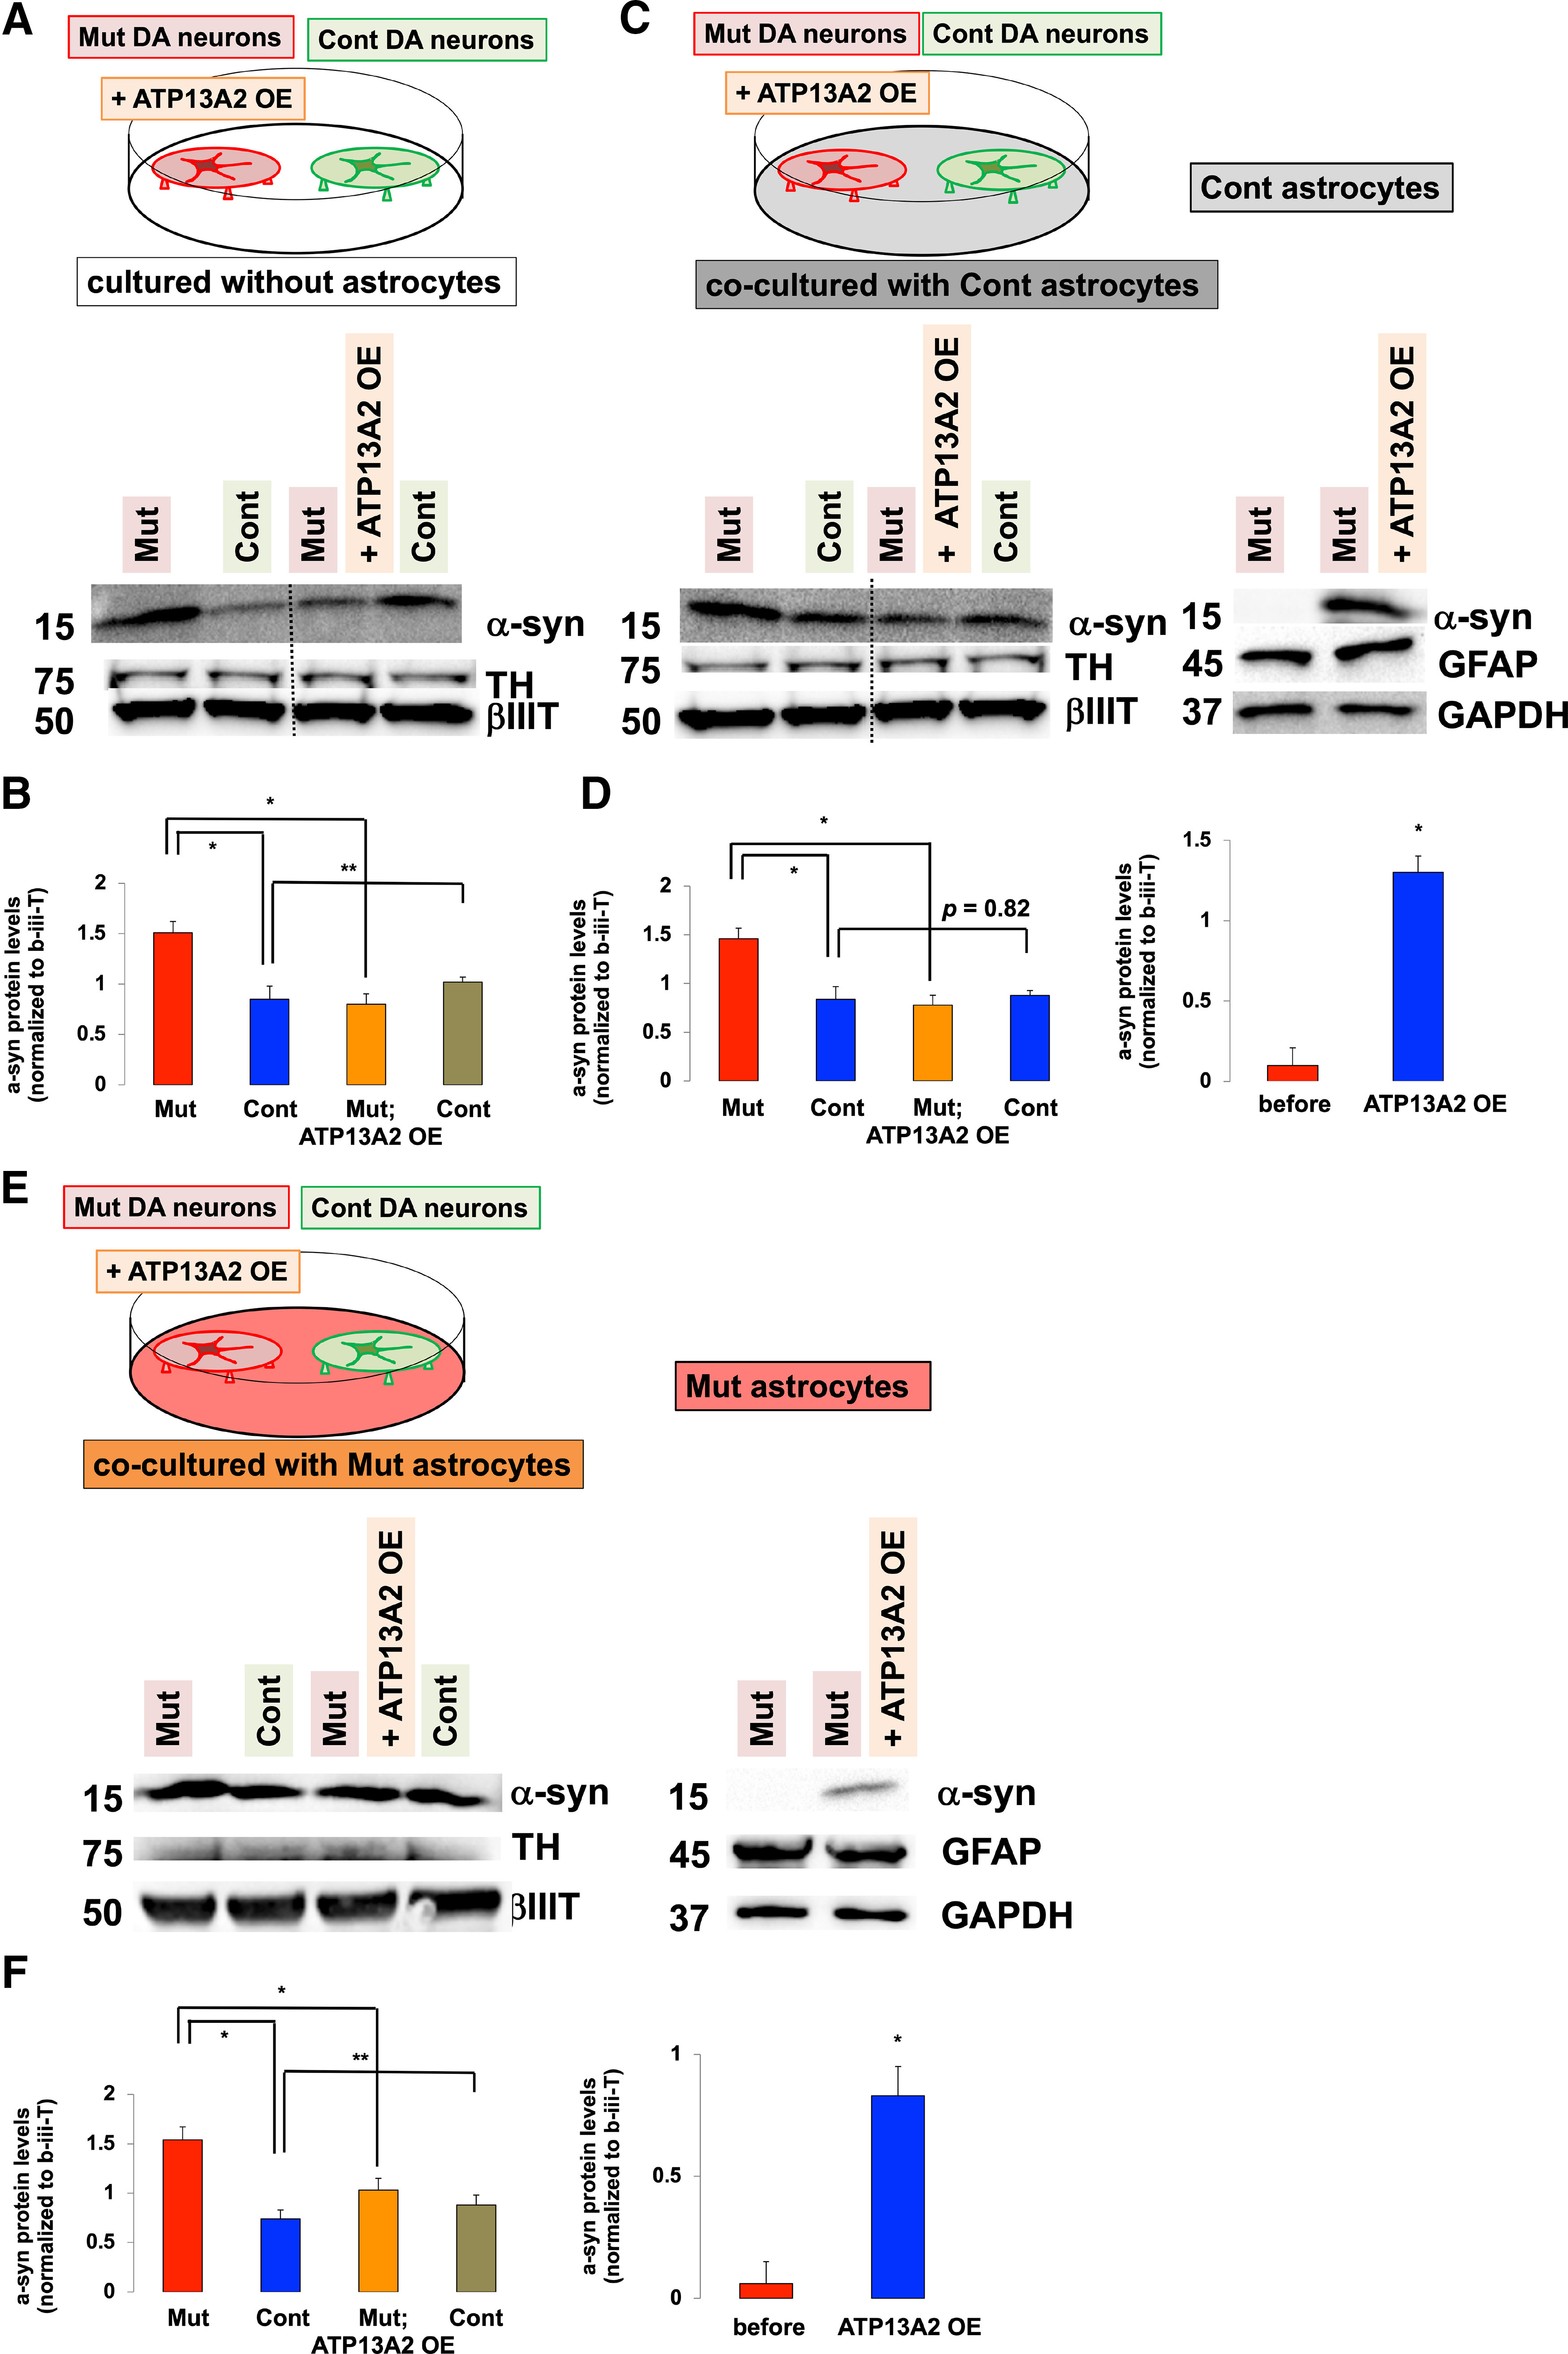
Coculturing neurons with astrocytes prevents α-syn transfer between neurons. A–D, The effect of coculturing astrocytes on the α-syn transmission between neurons. A, The α-syn transmission from Mut (ATP13A2 Mut 1) to Cont (Cont 1) DA neurons in the absence of coculturing astrocytes. Immunoblot analysis of α-syn levels in Mut and Cont DA neurons (left two columns) and α-syn levels in ATP13A2 overexpressing Mut and Cont DA neurons (right two columns). B, Densitometric quantification of α-syn levels normalized to β-III-tubulin in neurons that were not cocultured with astrocytes (n = 3, *p = 0.029, **p = 0.017, one-way ANOVA with Tukey's post hoc test). C, The α-syn transmission from Mut to Cont DA neurons in the presence of coculturing Cont astrocytes. Immunoblot analysis of α-syn levels in Mut and Cont neurons (first two columns) and α-syn levels in ATP13A2 overexpressing Mut and Cont DA neurons (next two columns) after being cocultured with Cont astrocytes. Immunoblot analysis of α-syn levels in Cont astrocytes cocultured with Mut and ATP13A2 overexpressing Mut DA neurons (right two columns). D, Densitometric quantification of α-syn levels normalized to β-III-tubulin in neurons in the presence of coculturing astrocytes (left graph; n = 3, *p = 0.027, one-way ANOVA with Tukey's post hoc test). Densitometric quantification of α-syn levels normalized to GFAP in Cont astrocytes (right graph; n = 3, *p = 0.002, Student's t test). E, F, The α-syn transmission from Mut to Cont DA neurons in the presence of coculturing Mut astrocytes. E, Immunoblot analysis of α-syn levels in Mut and Cont neurons (left two columns) and α-syn levels in ATP13A2 overexpressing Mut and Cont DA neurons (next two columns) after cocultured with Mut 1 astrocytes. Immunoblot analysis of α-syn levels in Mut astrocytes that were cocultured with Mut and ATP13A2 overexpressing Mut DA neurons (right two columns). F, Densitometric quantification of α-syn levels normalized to β-III-tubulin in neurons in the presence of coculturing Mut astrocytes (left graph; n = 3, *p = 0.017, **p = 0.022, one-way ANOVA with Tukey's post hoc test). Densitometric quantification of α-syn levels normalized to GFAP in Mut astrocytes (right graph; n = 3, *p = 0.003, Student's t test). Error bars indicate the SEM.
