Figure 5.
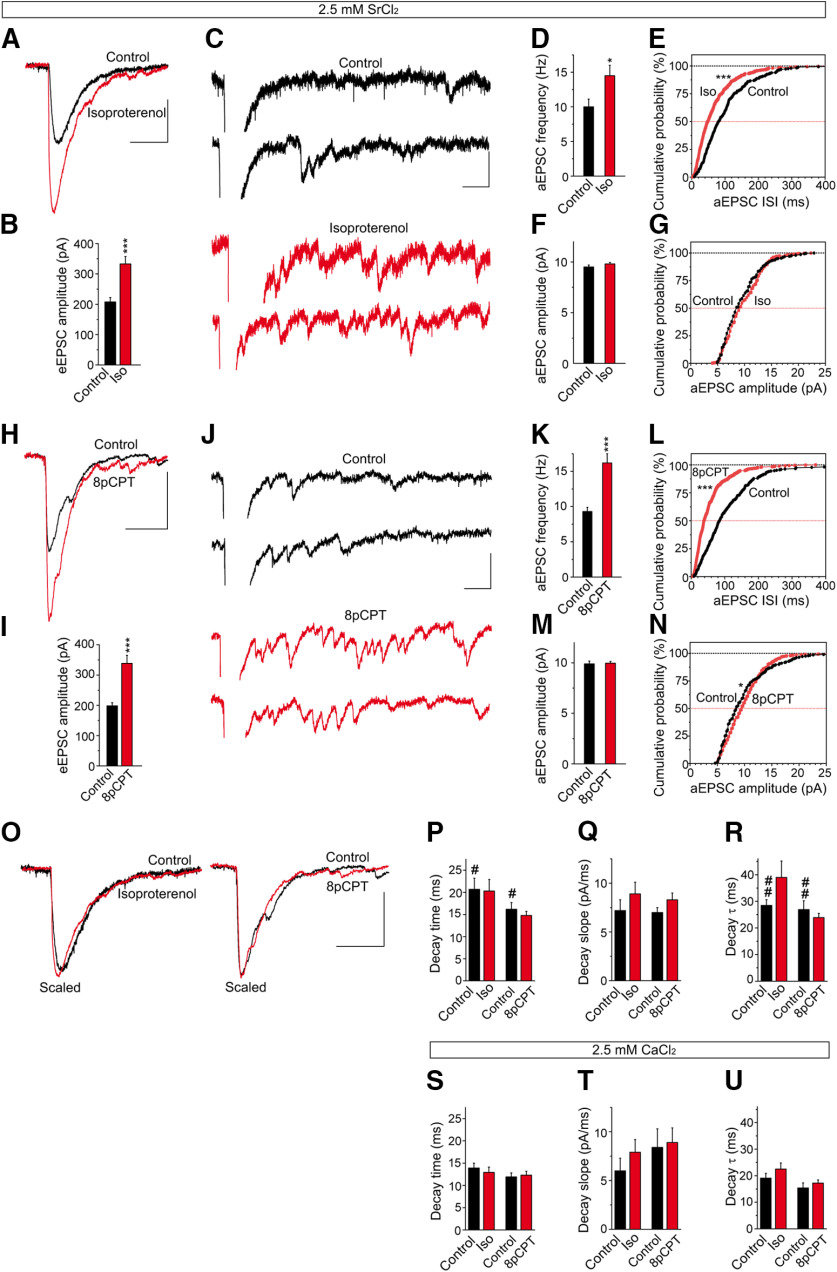
Isoproterenol and 8pCPT enhance the frequency but not the amplitude of the asynchronous release events. A, H, The effects of isoproterenol (100 μm, 10 min) and 8pCPT (50 μm, 10 min) on eEPSCs recorded in the presence of Sr2+ (2.5 mm). C, J, Individual traces showing asynchronous release events in control conditions (black) and after isoproterenol (C, red) or 8pCPT treatment (J, red). B, I, Quantification of the effects of isoproterenol (n = 10 cells/10 slices/8 mice, t = 4.416, df = 14) and 8pCPT (n = 10 cells/10 slices/8 mice, t = 5.128. df = 12) on eEPSC amplitude. D–G, K–N, Quantification of the changes in aEPSC frequency and amplitude induced by isoproterenol (D–G) and 8pCPT (K–N). The aEPSC frequency was enhanced by isoproterenol (D, E: n = 10 cells/10 slices/8 mice, t = 2.419, df = 18) and 8pCPT (K, L: n = 10 cells/10 slices/7 mice, t = 5.073, df = 12), without changing the aEPSC amplitude in isoproterenol (F, G: n = 10 cells/10 slices/7 mice, t = 1.180, df = 734) and 8pCPT (M, N: n = 10 cells/10 slices/7 mice, t = 0.2137, df = 484). Calibration: A, H, 100 pA and 50 ms; C, J, 25 pA and 50 ms. O, Effects of isoproterenol and 8pCPT on eEPSC kinetics in the presence of Sr2+ analyzed in scaled representations. P, The decay time (ms) was not altered by isoproterenol (t = 0.1109, df = 18) or by 8pCPT (t = 0.8003, df = 18). Q, The decay slope pA/ms was not modified by isoproterenol (t = 1.033, df = 18) or by 8pCPT (t = 1.51, df = 18). R, The decay tau (ms) was not changed by isoproterenol (t = 1.628, df = 11) or by 8pCPT (t = 0.818, df = 13). S–U, Effect of isoproterenol and 8pCPT on eEPSC kinetics in the presence of Ca2+. S, The decay time was not altered by isoproterenol (t = 0.6143, df = 24) or by 8pCPT (t = 0.3143 df = 22). T, The decay slope (pA/ms) was not changed by isoproterenol (t = 1.033, df = 24) or by 8pCPT (t = 0.2965, df = 22). U, The decay tau (ms) was not modified by isoproterenol (t = 1.164, df = 24) or by 8pCPT (t = 0.4317, df = 22). Replacing Ca2+ with Sr2+ increased the control decay time (t = 2.267, df = 12) and control decay tau (t = 3.409, df = 21). Calibration: O, 100 pA and 50 ms. The data represent the mean ± SEM.

