
Figure 7.
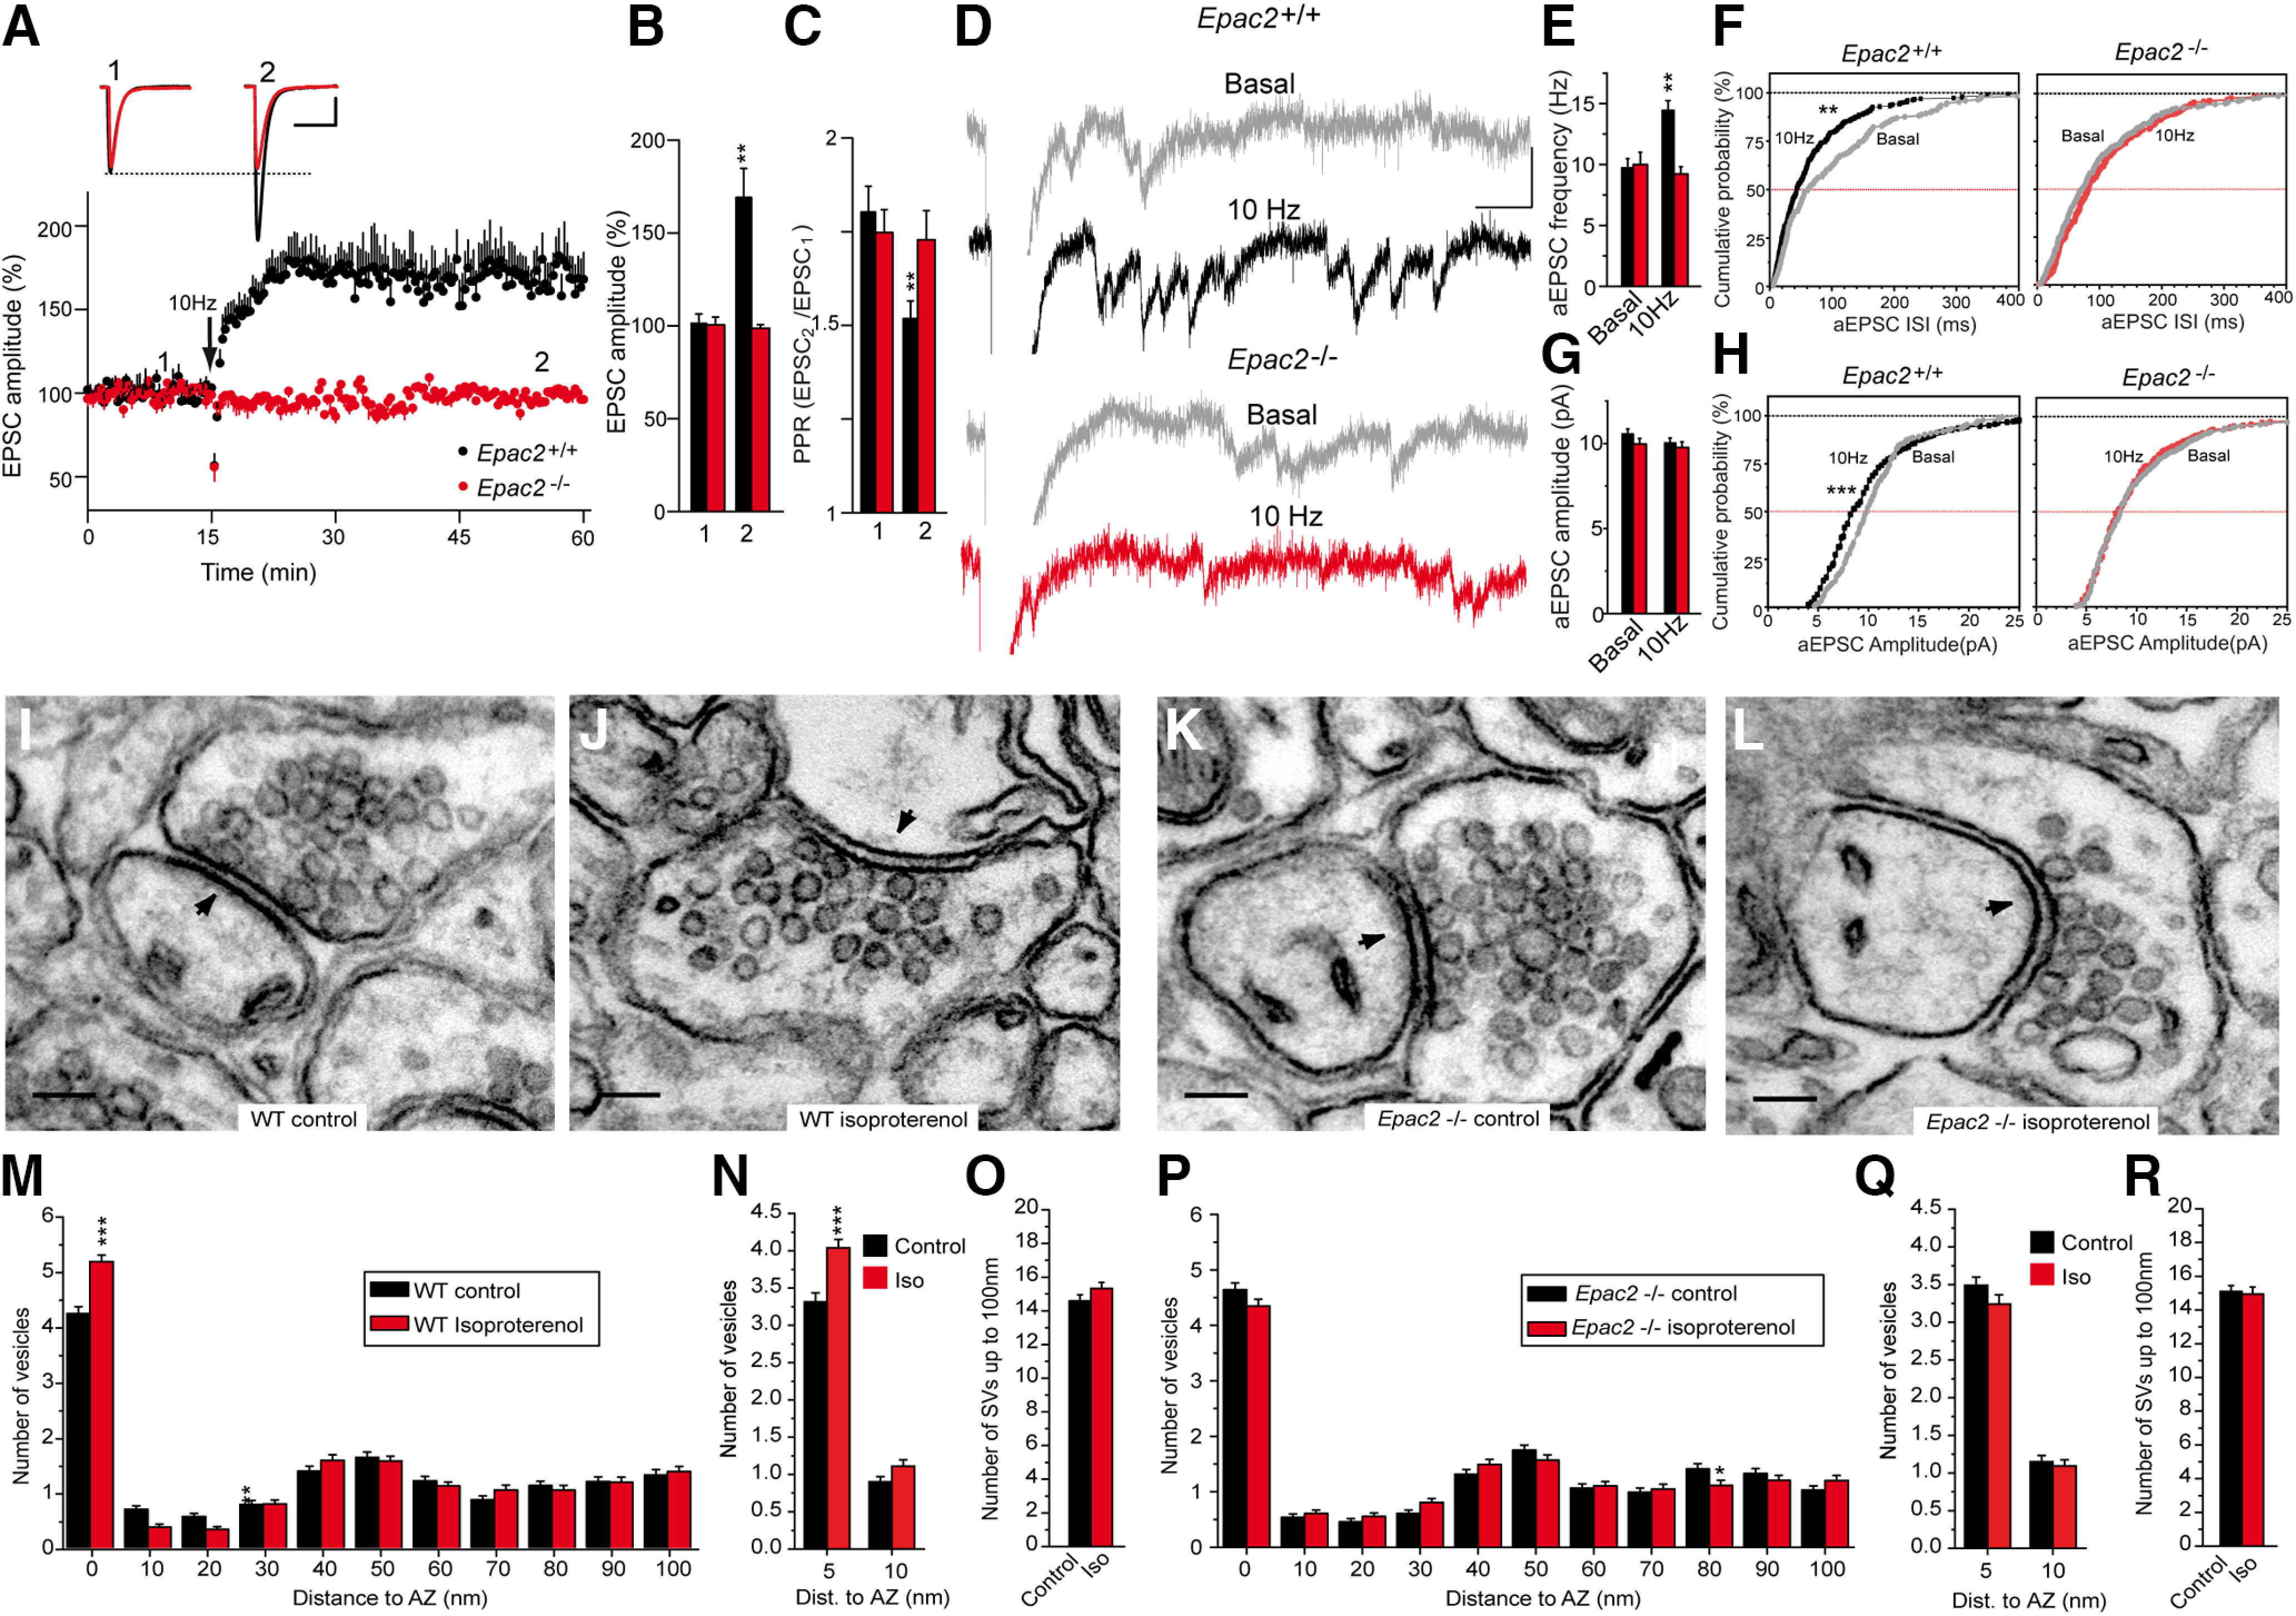
Epac2−/− slices lack PF–PC LTP, and they display no isoproterenol induced increase in SV docking. A, A 10 Hz, 10 s stimulation induced a sustained increase in the EPSC amplitude in WT cerebellar slices that was absent in slices from Epac2−/− littermates. B, Quantification of the changes in EPSC amplitude measured 40 min after stimulation (2) in slices from WT (n = 13 cells/13 slices/6 mice, t = 3.745, df = 13) or Epac2−/− mice (n = 15 cells/15 slices/8 mice, t = 0.4169, df = 15) compared with the values before stimulation (1). C, Quantification of the changes in the PPR measured 40 min after stimulation (2) in slices from WT (t = 3.403, df = 24) and Epac2−/− mice (t = 0.2000, df = 28) compared with the values before stimulation (1). D, The aEPSCs induced when replacing Ca2+ with Sr2+ (2.5 mm) 30 min after 10 Hz stimulation. After 5 min, individual traces showing aEPSCs were analyzed (2 min) in basal (gray) and stimulated WT (black) or Epac2−/− (red) slices. E, F, Changes in aEPSC frequency induced by 10 Hz stimulation in WT (t = 4.321, df = 11) and Epac2−/− (t = 0.6774, df = 14) slices. G, H, Changes in aEPSC amplitude induced by 10 Hz stimulation in WT (t = 1.225, df = 424) and Epac2−/− (t = 0.4063, df = 459) slices. I, J, Isoproterenol (100 μm, 10 min) increases SV docking in WT mice. M, Quantification of the isoproterenol induced an increase in SV docking in WT mice. N, Isoproterenol increases the number of SVs 0–5 nm from the AZ membrane without changing the SVs 5–10 nm from the AZ membrane in WT slices. O, Isoproterenol treatment did not change the total number of SVs up to 100 µm from the AZ in WT slices. K, L, Isoproterenol treatment fails to increase SV docking in Epac2−/− mice. P, Quantification of the isoproterenol-induced increase in SV docking in Epac2−/− slices. Q, Isoproterenol did not change the number of SVs within 5 or 5–10 nm from the AZ membrane in Epac2−/− slices. R, Isoproterenol treatment did not change the total number of SVs up to 100 µm from the AZ membrane in Epac 2−/− slices. Calibration: A, 50 pA and 15 ms; D, 20 pA and 40 ms. Scale bars: I–L, 100 nm. The data represent the mean ± SEM.