
Figure 8.
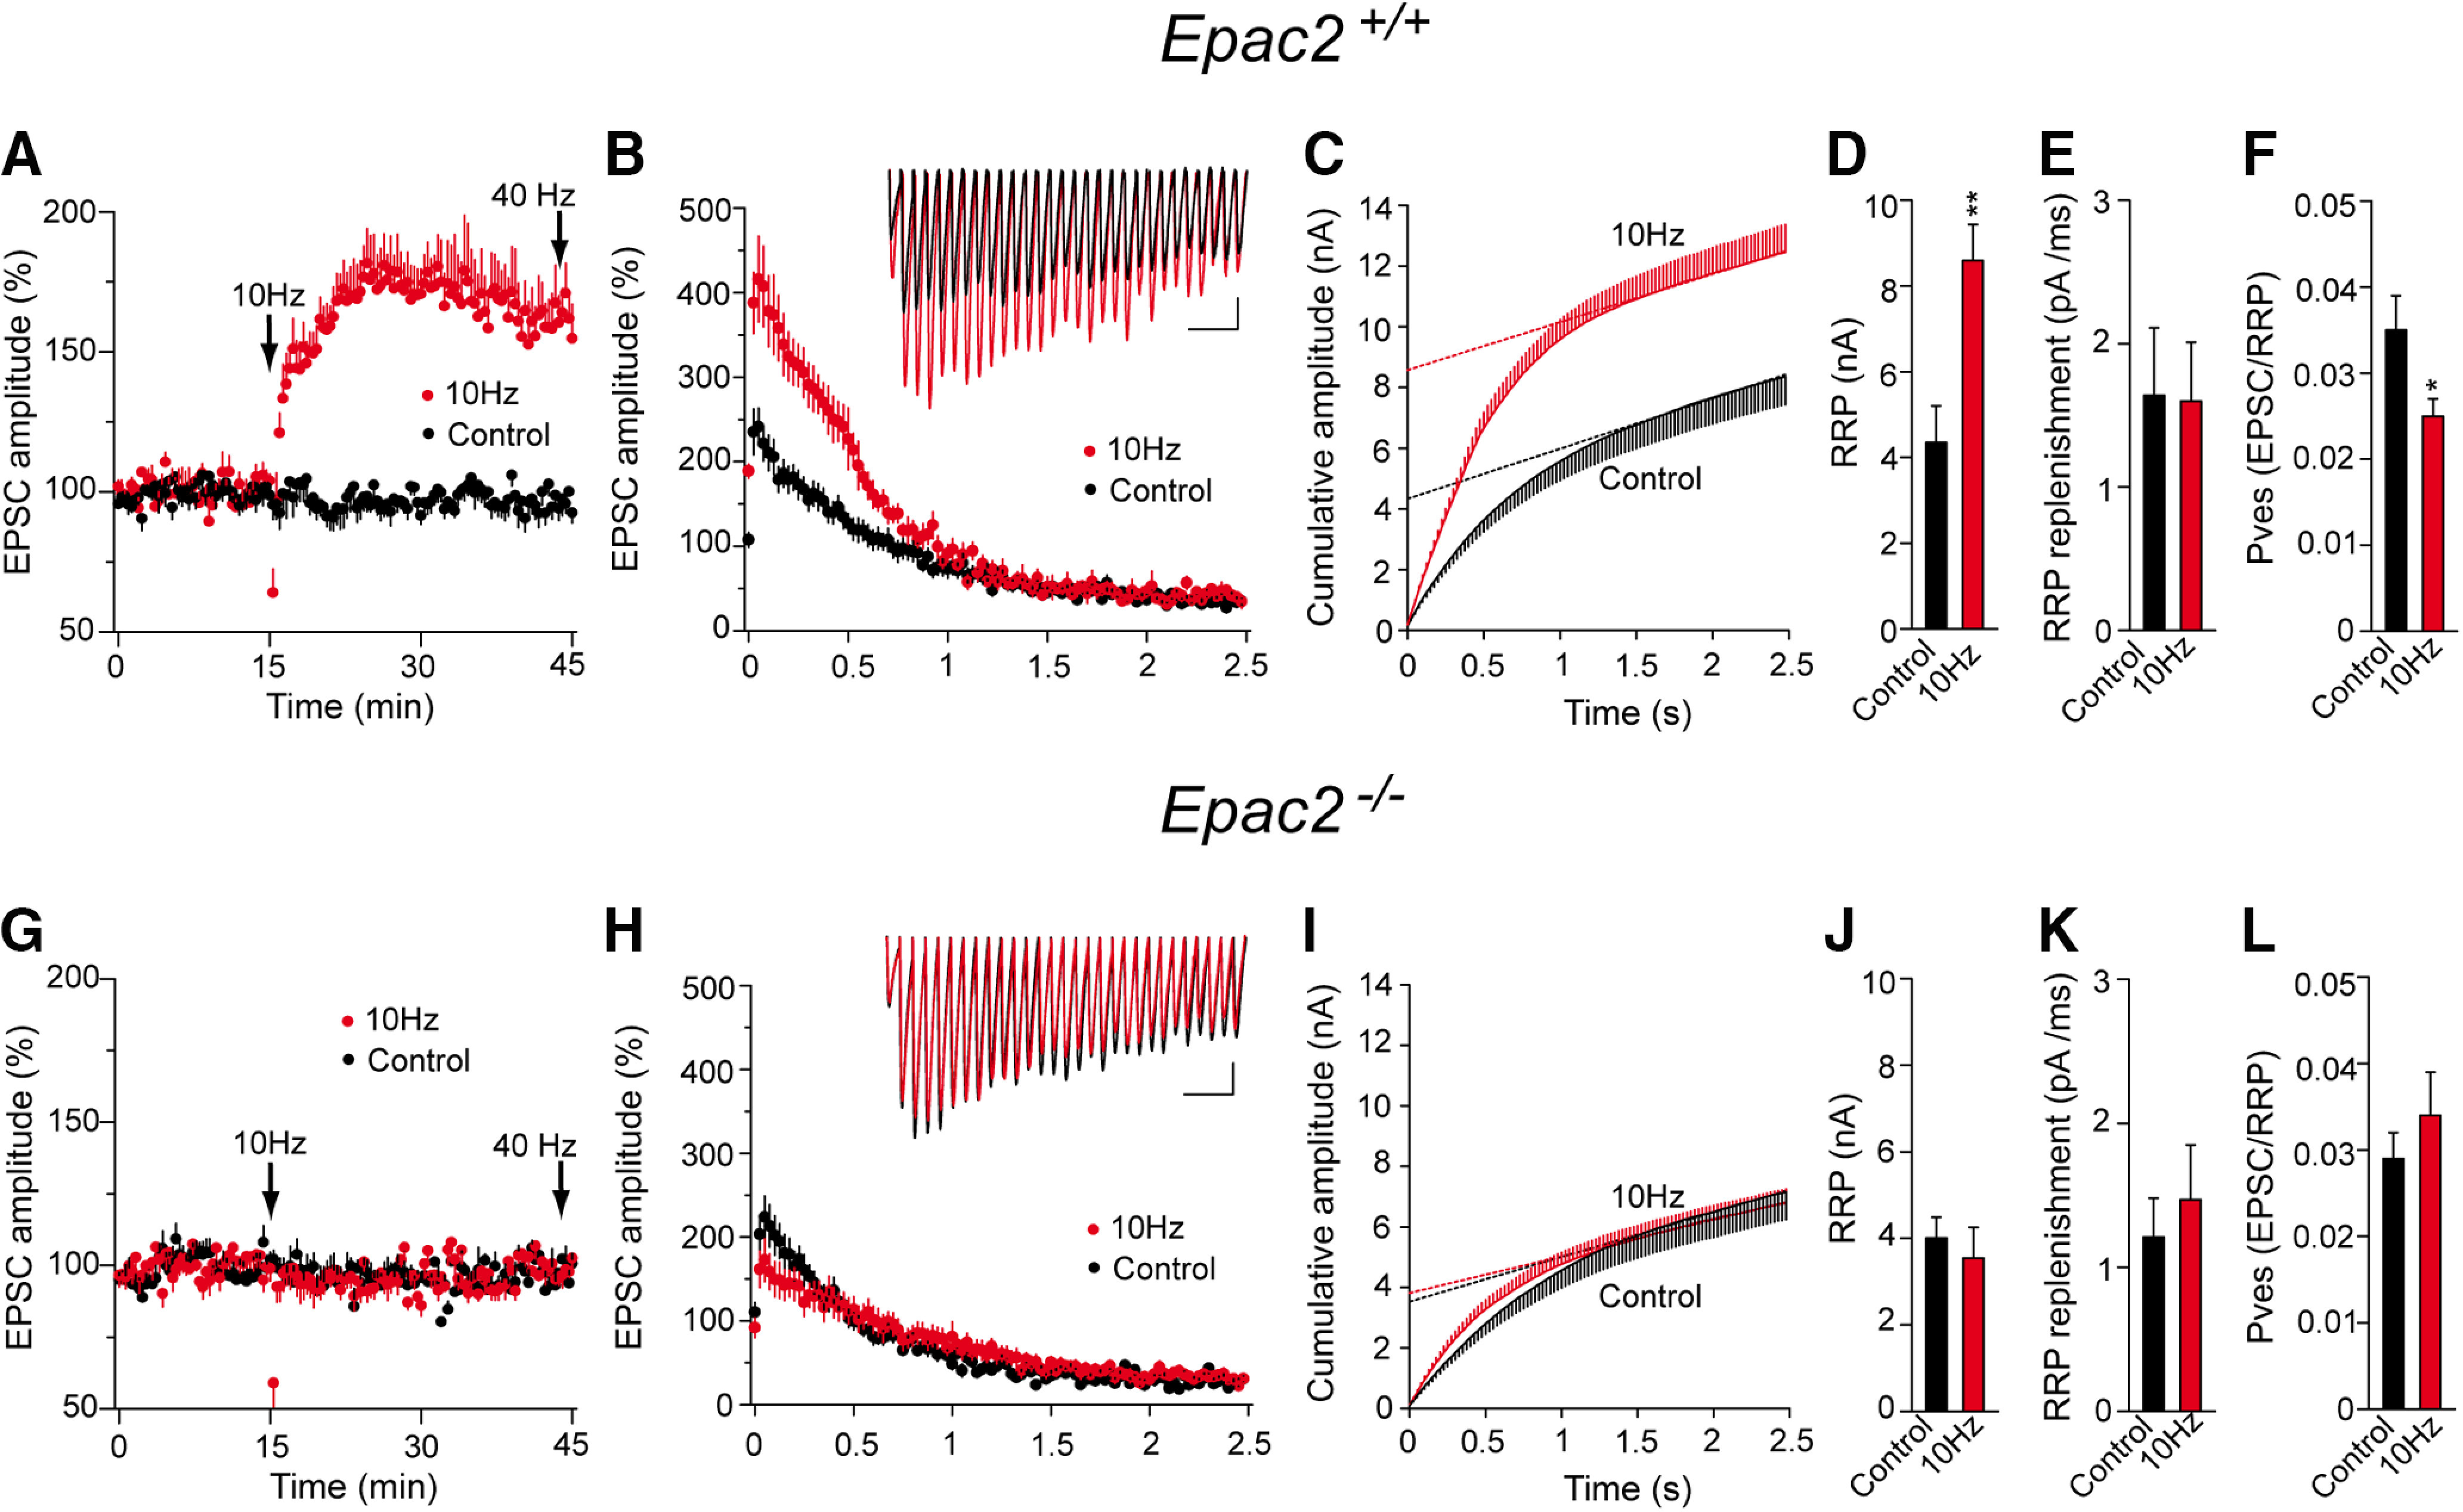
PF–PC LTP is associated with an increase in the RRP size that does not occur in Epac2−/− mice. A, G, The RRP size was measured after a train of 100 pulses at 40 Hz applied 30 min after LTP induction, as well as in control (unstimulated) slices from both WT and Epac2−/− mice (littermates). B, H, EPSC amplitude during the 40 Hz train, the traces showing individual examples. Calibration: 100 pA and 100 ms. C, I, Cumulative EPSC amplitudes in control and LTP-induced cells. The RRP size was calculated from the cumulative amplitude plots as the y-intercept from a linear fit of the steady-state level attained during the high-frequency train. D, J, Quantification of the changes in the RRP size induced by a 10 Hz stimulus in slices from WT (D: control slices, n = 18 cells/18 slices/8 mice, 10 Hz stimulated slices, n = 21 cells/21 slices/9 mice, t = 3.506, df = 37) and Epac2−/− mice (J: control slices, n = 21 cells/21 slices/10 mice, and 10 Hz stimulates slices, t = 0.5379, df = 39). E, K, Quantification of the replenishment rate (pA/ms) in slices from WT mice (E: t = 0.064, df = 37) and Epac2−/− mice (K: t = 0.5578, df = 40). F, L, Quantification of the pves in slices from WT mice (F: t = 2.236, df = 25) or Epac2−/− mice (L: t = 0.8575, df = 37). The data represent the mean ± SEM.