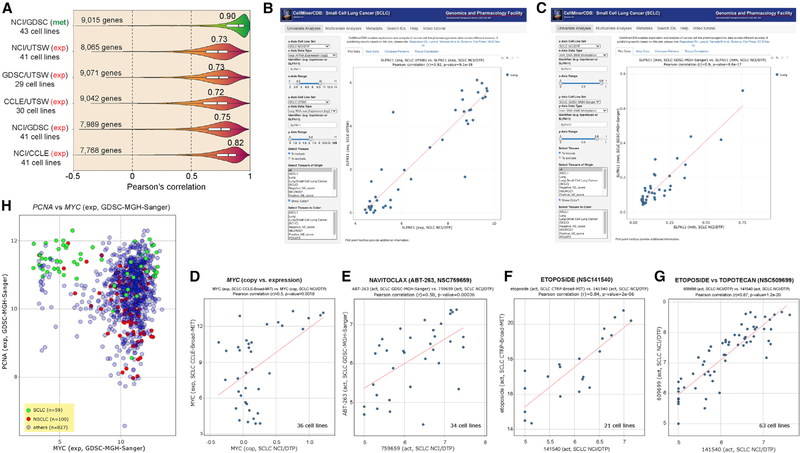
Figure 2. Validation and Reproducibility of the SCLC-CellMiner Data and Snapshots of Representative Outputs of SCLC-CellMiner (https://discover.nci.nih.gov/SclcCellMinerCDB/).
(A) Reproducibility between data sources. Pearson’s correlations are indicated above violin plots.
(B) Snapshot showing the reproducibility of SLFN11 gene expression across the 41 common cell lines (AffyArray for NCI/DTP on the x axis versus RNA-seq for UTSW). Each dot is a cell line. The data can also be readily displayed in tabular form and downloaded in tab-delimited format by clicking on the “View Data” tab to the right of the default “Plot Data” tab.
(C) Snapshot showing the reproducibility of SLFN11 promoter methylation across the 43 common cell lines independently of the methods used (850K Illumina Infinium MethylationEPIC BeadChip array for NCI/DTP versus Illumina HumanMethylation 450K BeadChip array for GDSC).
(D) Highly significant correlation between MYC copy number (NCI/DTP) and MYC expression (CCLE) for the 36 common SCLC cell lines.
(E–G) Examples of drug activity across databases for the common cell lines.
(H) High proliferation signature of SCLC cell lines on the basis of high PCNA and MYC expression. Snapshot shows that SCLC (green) overexpress PCNA and fall into two groups with respect to MYC.

