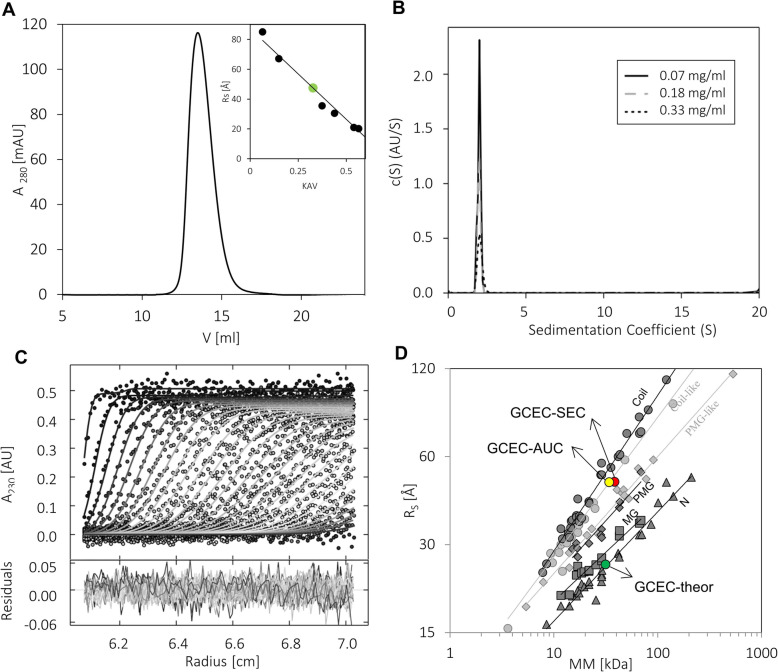
Fig. 2.
Hydrodynamic properties of GCEC. a Analytical SEC of GCEC performed on a Superdex200 10/300 GL column. The graph presents the elution volume of GCEC in a concentration of 1 mg/ml. The inset represents the standard curve determined with standard proteins (black dots). The green circle corresponds to the GCEC. b AUC analysis. The graph presents the sedimentation coefficient distributions c(S) for the GCEC at three concentrations: 0.30 mg/ml (black solid line), 0.18 mg/ml (grey dashed line), and 0.07 mg/ml (black dotted line). All data were collected at 230 nm. c The representative example of the GCEC sedimentation profile. Selected experimental (circles) and fitted SV profiles (solid lines for GCEC at 0.30 mg/ml) are shown. d The relationship between the hydrodynamic radii (RS) and the relative MMs determined for four globular proteins states (dark grey) and two IDPs states (light grey) [51, 52]. The globular proteins states are: native proteins (N, tringles), molten globules (MG, squares), pre-molten globules (PMG, diamonds), and 6 M GdmCl-unfolded proteins (coil, circles). The two IDPs states are: coil-like (circles), and PMG-like (diamonds). The theoretical value for GCEC (green dot) and experimental values (SEC – red dot or AUC yellow dot) are shown

