Fig. 3.
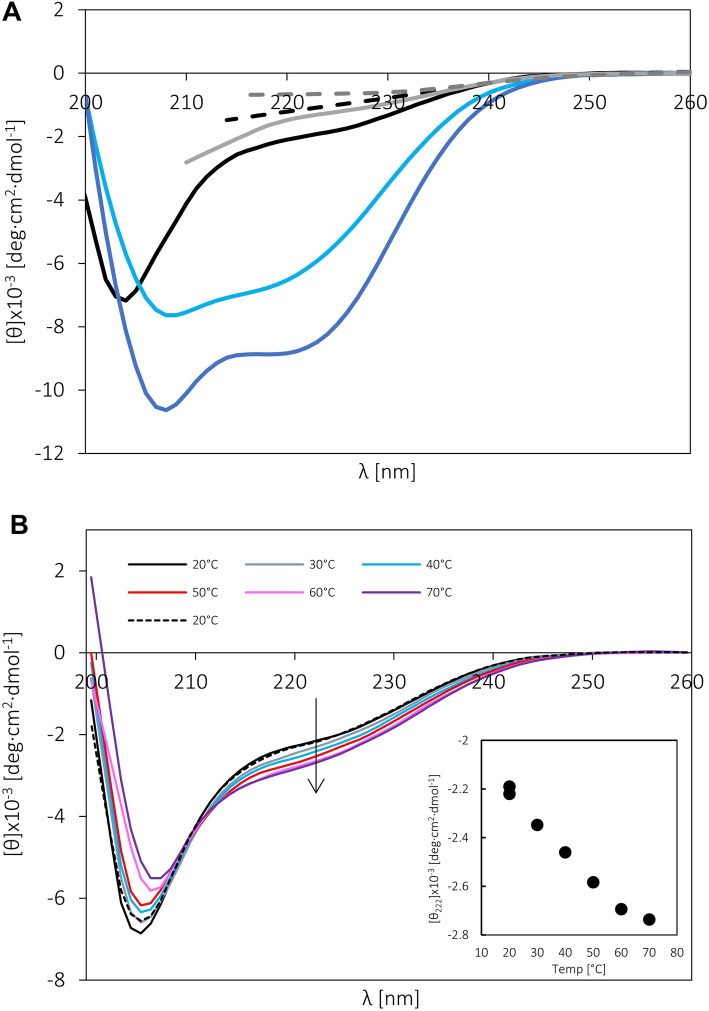
The far-UV CD spectra of GCEC. a The CD spectra recorded in buffer F at 20 °C for GCEC: the reference spectrum (black solid line), the spectrum in the presence of 15% TFE (blue solid line) or 30% TFE (dark blue solid line), and the spectrum in the presence of 1 M GdmCl (grey solid line), 2 M GdmCl (black dashed line) or 4 M GdmCl (grey dashed line). b The CD spectra of GCEC recorded in buffer F at different temperatures. Inset: dependence of molar residual ellipticity at 222 nm on the temperature. The linear character of the plot indicates no cooperative transition between extreme conformational states

