FIGURE 2.

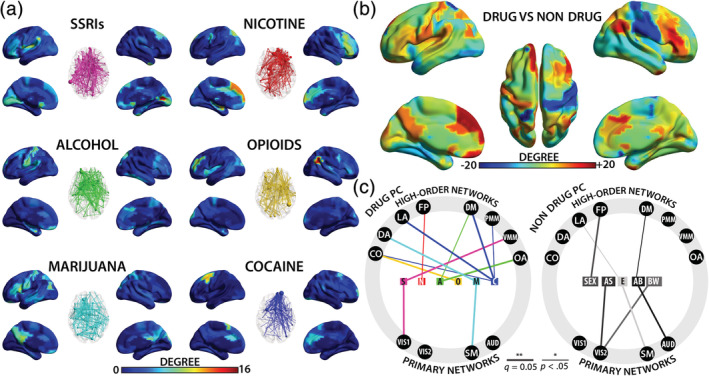
Spatial distribution of PDE effects and their relation to different functional networks. (a) Drug‐specific heat maps depicting regional degree and corresponding glass–brain connection models. Warmer colors and larger nodes represent regions with higher degree or number of significant effects, in the surface and glass brain plots, respectively. (b) Drug versus nondrug composite heat maps. Warmer colors depict regions with more drug‐related effects while cooler colors depict regions with more nondrug‐related effects. (c) Summary of significant network‐level effects grouped by drug and nondrug PCs. A, alcohol; AB, gestational age at birth; AS, gestational age at scan; AUD, auditory; BW, birthweight; C, cocaine; CO, cingulo‐opercula; DA, dorsal attention; DM, default mode; E, maternal depression indexed by Edinburgh Postnatal Depression Scale value (EPDS); FP, fronto‐parietal; M, marijuana; N, nicotine; LA, language; O, opioids; OA, orbital affective; PC, participant characteristics; PDE, prenatal drug exposure; PMM, posterior multimodal; S, selective serotonin reuptake inhibitor (SSRI); Sex, infant sex; SM, sensorimotor; VIS1, primary visual, VIS2, secondary visual; VMM, ventral multimodal
