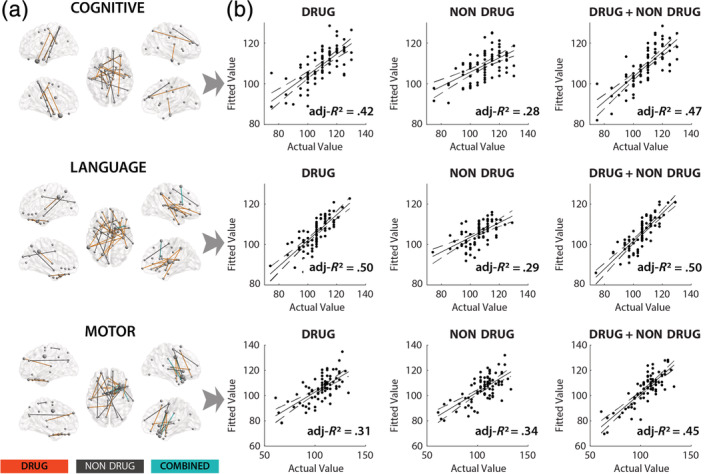
FIGURE 3.

Behavioral correlations of the detected functional connections showing either PDE or nondrug PC effects. (a) Glass‐brain models depicting significant (FDR corrected; q = 0.05) FC–BEHAVIOR (cognitive, language, and motor) relationships within identified functional connections showing either significant PDE or nondrug PC effects. (b) Multivariate prediction of behavioral outcome measures using different grouping schema; drug‐related connections (DRUG), nondrug‐related connections (NONDRUG), and all connections (DRUG + NONDRUG). Solid line represents least‐squares fit. Dashed‐lines correspond to 95% confidence bounds. Dots denote individual subjects (n = 80). X‐axis represents actual cognitive, language, and motor scores while Y‐axis represents fitted values based on multivariate regression using corresponding groups of connections (i.e., drug related, nondrug related, and combined). FDR, false discovery rate; PC, participant characteristics; PDE, prenatal drug exposure
