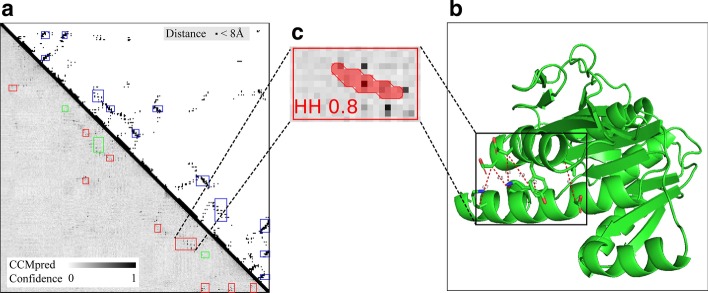
Fig. 4.
Prediction of inter-SSE contacts for protein 3a4tA using ISSEC. a The upper-right triangle shows true inter-residue contacts and true contacting SSEs (rectangle regions in blue). The lower-left triangle shows the predicted contacting SSEs and the predicted probability of inter-residue contacts. Here, rectangle regions in red represent true positive prediction where green ones represent incorrect predictions. b The native 3D-structure of the protein 3a4tA. Here, two contacting helices are shown in the box. c The prediction results for the contacting helices: type: HH, Confidence score: 0.80, and masks shown in red

