
FIGURE 4.
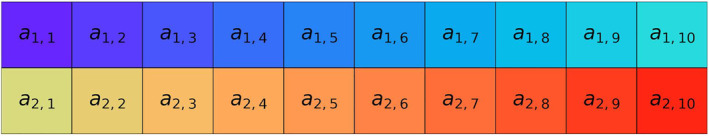
Two‐time series (p = 2) with N = 10 samples. The time series considered represent two signals for the scale factor ε = 1
Official websites use .gov
A
.gov website belongs to an official
government organization in the United States.
Secure .gov websites use HTTPS
A lock (
) or https:// means you've safely
connected to the .gov website. Share sensitive
information only on official, secure websites.
Two‐time series (p = 2) with N = 10 samples. The time series considered represent two signals for the scale factor ε = 1