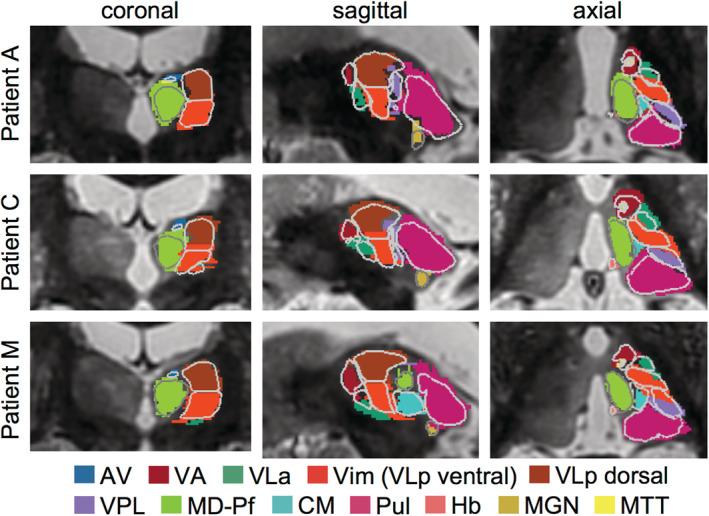
FIGURE 4.

Agreement between manual and THOMAS automated segmentations of the Vim in WMnMPRAGE images. Overlay of manual (filled nuclei) and THOMAS (gray outlines) segmentations in three cases with the best (Patient A, Dice = 0.90), average (Patient C, Dice = 0.74), and worst (Patient M, Dice = 0.55) Dice values for the Vim. Group mean Vim Dice = 0.67 ± 0.07 (see Table 2). Coronal, axial, and sagittal slices are shown centered on the Vim. This analysis used 7T WMnMPRAGE images for all patients, except Patient C, for whom a 3T WMnMPRAGE image was used due to a lack of a 7T WMnMPRAGE image. Thalamic nuclei abbreviations defined in Figure 1
