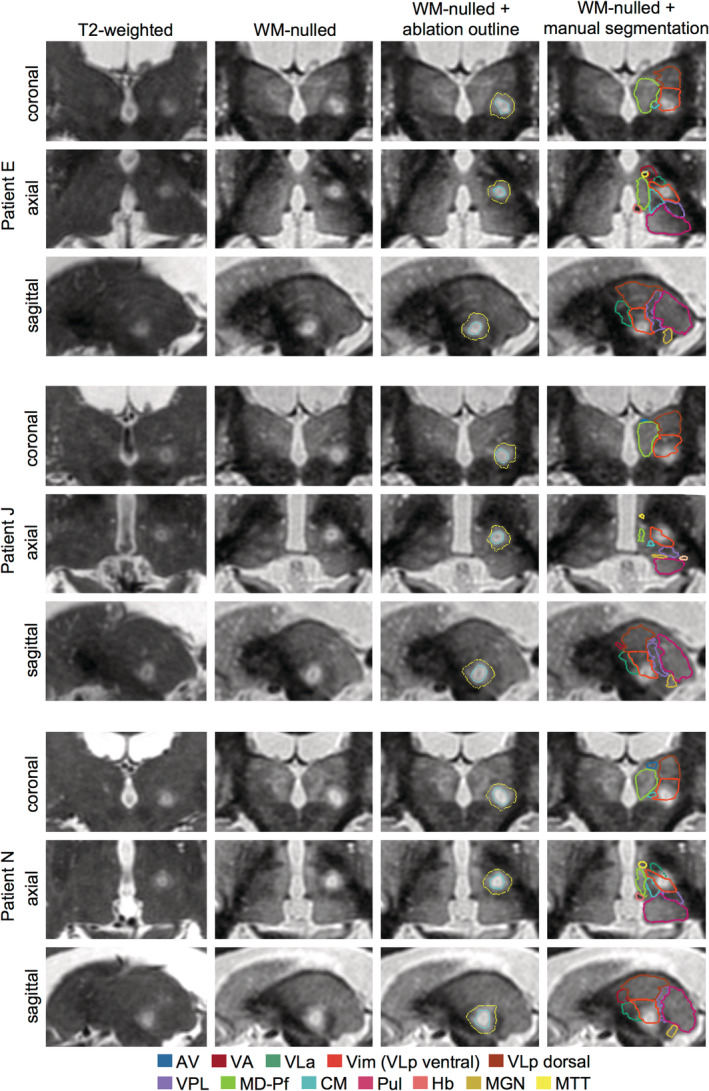
FIGURE 5.

Comparison of immediate post‐treatment 3T WMnMPRAGE images and standard T2‐weighted images in three representative patients. Coronal, axial, and sagittal slices are shown centered on the FUS ablation. Note the improved visibility of the ablation in the WMnMPRAGE images compared to the T2‐weighted images, allowing clearer delineation of an outer penumbra (yellow outline), more hyperintense core (cyan outline), and, in many cases, a hypointense region within the core. For all patients, the ablations were located within and around the Vim (orange outline) defined by manual segmentation in the WMnMPRAGE images. Thalamic nuclei abbreviations defined in Figure 1
