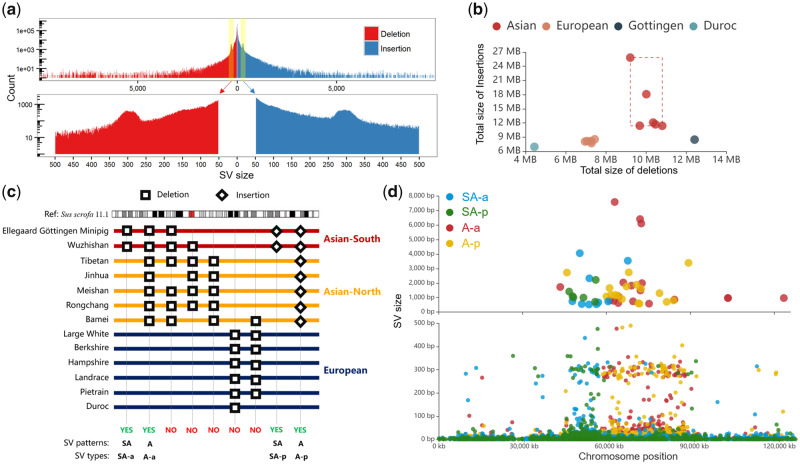
Fig. 1.
Genome-wide identification of SVs between Chinese and European pigs. (a). Genomic distribution of high-precision SVs in 13 pig genome assemblies. The bar plot indicates the frequency distribution of SV size for all insertions and deletions ranging between 1 bp and 10 kb. The x axis represents the SV size and the y axis indicates the count of SV. (b) Genomic differences between 13 pig genome assemblies and the Duroc reference genome are reflected in the coordinate axis, whereas the x axis and y axis represent the total size of deletions and insertions, respectively. (c) Classification strategy of pattern-related SVs. Four types of SVs were extracted from the nonoverlapping SV data set. The “yes” and “no” represent whether the SVs meet the pattern criteria and were retained. (d). Scatter diagram displaying the distribution of pattern-related SVs on the X chromosome. The x axis represents the chromosome position and the y axis represents the size of the SVs. The upper scatter plot indicates an SV size of >500 bp, whereas the lower chart indicates an SV size of <500 bp.

