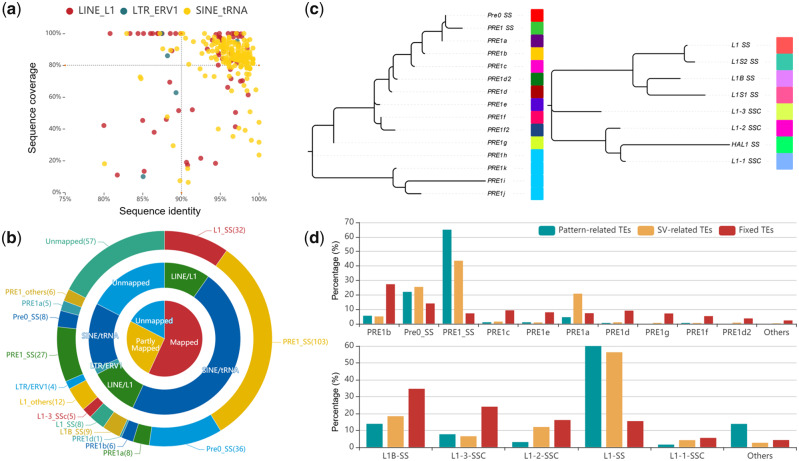
Fig. 3.
Formation of specific pattern-related SVs. (a) The coordinates indicate the confidence between SVs and TEs, where the x axis and y axis represent the percentage of sequence identity and sequence coverage, respectively. (b) The circular pie chart displays the classification and proportion of haplotype-related TEs based on how the homology is related to known TEs. (c) Phylogenetic tree for known PRE and L1 families in the pig genome, where different colors represent different TE subfamilies. (d) Bar charts indicate the percentage of SINE and LINE subfamilies from the different states, respectively. The upper bar plot shows the SINE family and the lower bar chart indicates the LINE family. The x axis and y axis represent the type of different TE subfamilies and their proportion, respectively.

