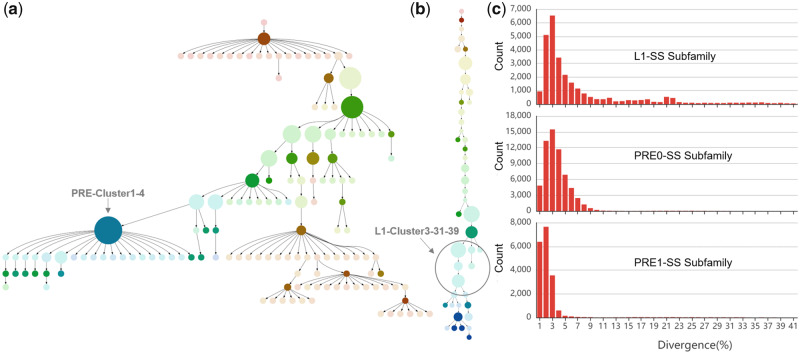
Fig. 4.
Classification and age divergence analyses of pattern-related TEs. (a) A MS tree of pig PRE-Cluster1 subfamilies. Each point represents a subfamily of PRE-Cluster1, and the size of the points indicates the number of corresponding subfamilies. (b) A MS tree of pig L1-Cluster3 subfamilies. Each point represents a subfamily of L1-Cluster3, and the size of the points indicates the number of corresponding subfamilies. (c) Sequence divergence distribution within the PRE1-SS, PRE0-SS, and L1-SS subfamilies. Sequence divergence distributions are plotted in bins of 0.01 increments. The activity time was calculated and displayed for PRE1-SS, PRE0-SS, and L1-SS subfamilies.

