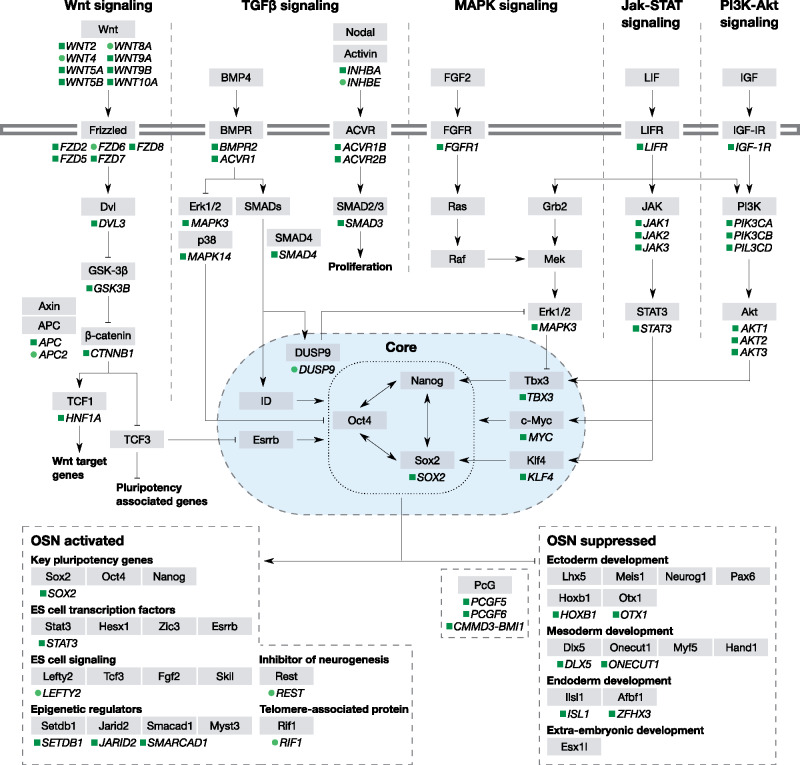
Fig. 2.
Trends in the stringency of purifying selection on the PGRN genes. Schematic representation of the PGRN according to KEGG is shown. Only genes with significant shifts in the stringency of purifying selection at 10% FDR or less are indicated: Green rectangle, intensification; lime circle, relaxation. Dashed lines indicate the subcircuits of the PGRN. Horizontal double line indicates the cellular envelop. Blue oval represents the nucleus. The genes under each subcircuit are simplified, see supplementary table S4, Supplementary Material online.

