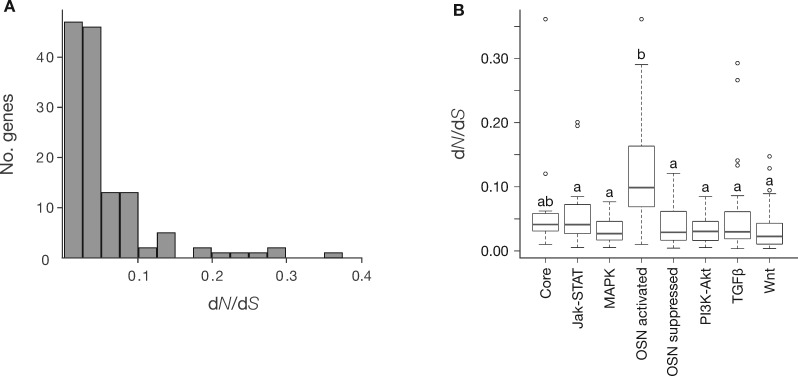
Fig. 3.
Conservation patterns of the PGRN. (A) Histogram of gene counts for dN/dS values showing distribution of evolutionary rates for the PGRN genes. (B) Box plots of the mean dN/dS values for the PGRN subcircuits. Multiple paired comparisons were tested with the Tukey–Kramer method, where subcircuits not assigned by the same latter are significantly different with P value of 0.05; error bars, 95% confidence interval. OSN represents OCT4 (POU5F1), SOX2, and NANOG.

