
FIGURE 1.
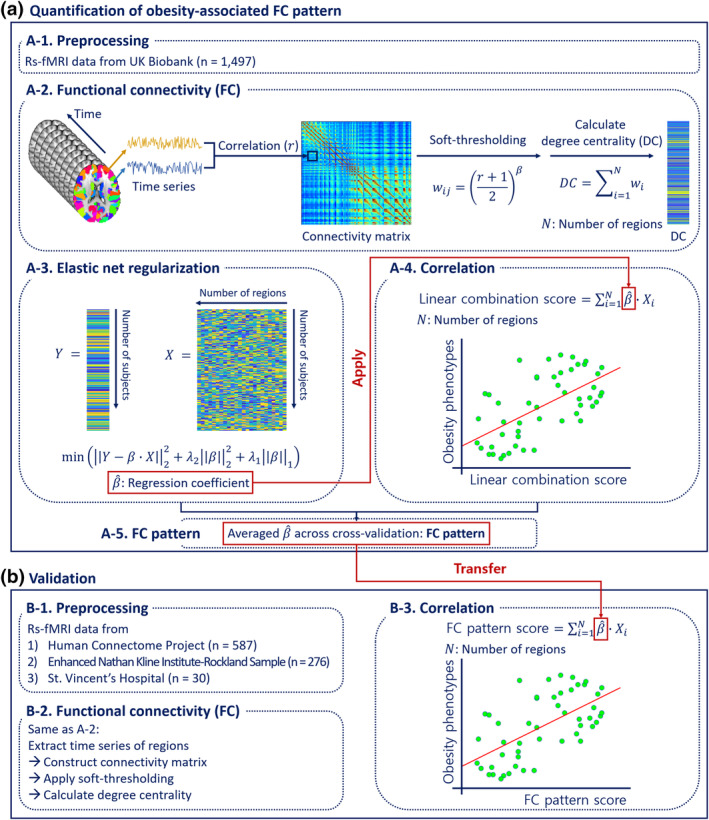
Flowchart of this study. (a) Quantification of FC pattern using data from the UK Biobank database. FC analysis was applied to the preprocessed rs‐fMRI data, and degree centrality values were calculated. Elastic net regularization was used to estimate regression coefficients. A single scalar score was computed using a linear combination of the estimated coefficients and degree centrality values, and it was correlated with obesity phenotypes. (b) Validation procedures. The same FC analysis was performed in independent datasets. The FC pattern developed using the UK Biobank dataset was transferred to the independent dataset to calculate the FC pattern score via a linear combination of the developed FC pattern and regional degree centrality values for all participants, which was correlated with their obesity phenotypes