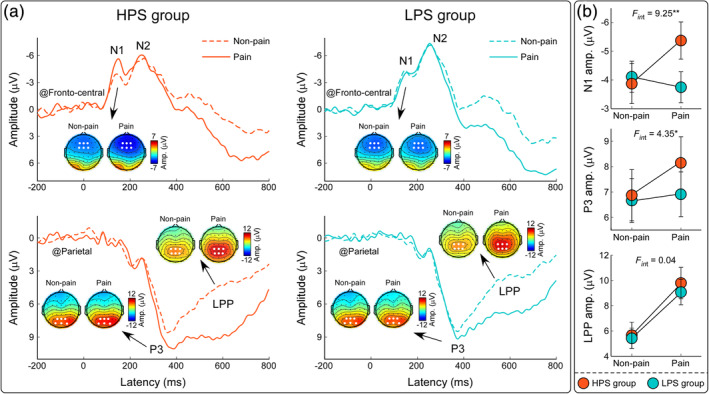
FIGURE 3.

ERP responses during the Pain Judgment Task. Grand average ERP waveforms and scalp topographies for HPS (orange lines) and LPS (blue lines) groups were elicited by painful (solid lines) and nonpainful (dashed lines) pictorial stimulations during the Pain Judgment Task. Displayed waveforms were measured at fronto‐central (F1, Fz, F2, FC1, FCz, FC2) and parietal (P1, Pz, P2, PO3, POz, PO4) electrodes. Amplitudes of dominant components (N1, P3, and LPP) elicited by painful and nonpainful stimulations were compared between HPS and LPS groups. Electrodes used to evaluate the ERP amplitudes were marked using enlarged white dots on the corresponding scalp topographies. Data are expressed as mean ± SEM. *p < .05, **p < .01
