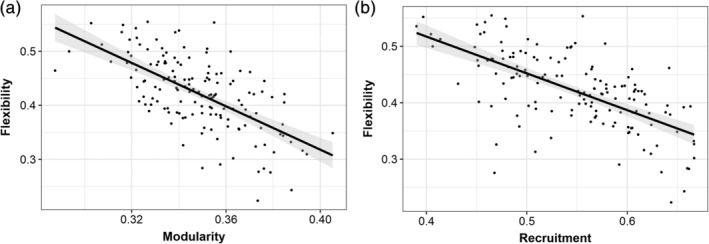
FIGURE 3.

The correlation analysis showed a strong negative association between modularity and flexibility (r(148) = −.64, p < .0001), and global recruitment and flexibility (r(148) = −.64, p < .0001)

The correlation analysis showed a strong negative association between modularity and flexibility (r(148) = −.64, p < .0001), and global recruitment and flexibility (r(148) = −.64, p < .0001)