
FIGURE 2.
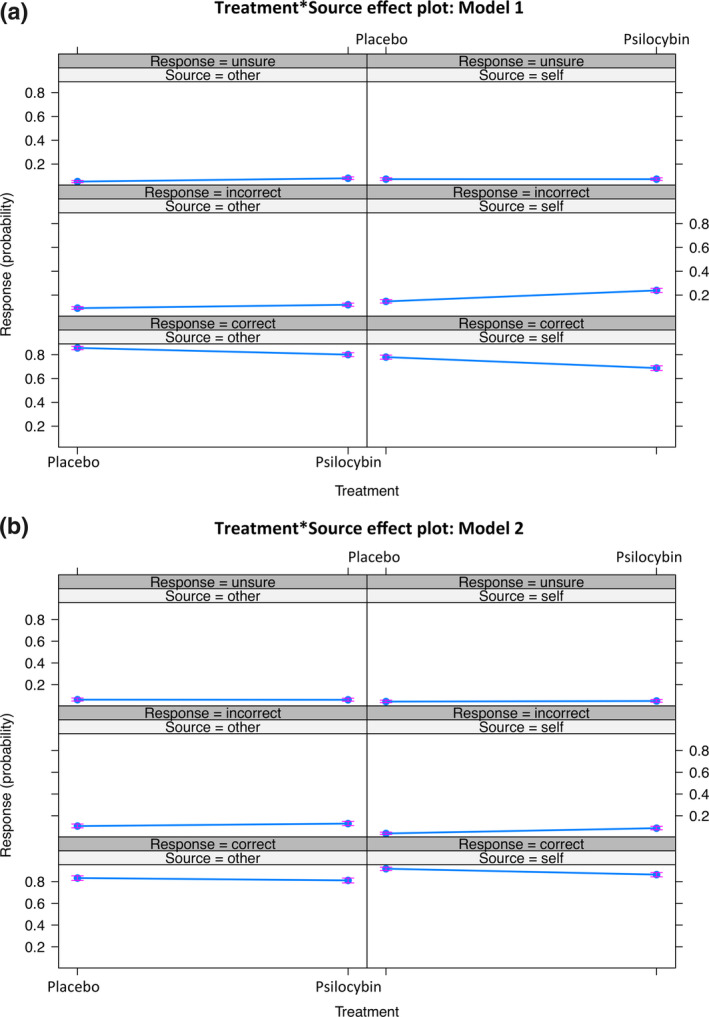
Response probability visualized as treatment by source interaction effects in the self‐monitoring task. Three formats of responses (correct, incorrect, unsure) are depicted on the plot as dependent on the source (“self,” “other”) and treatment (placebo, psilocybin). Model 1 (a) includes all data, and Model 2 (b) discards the pitch‐shifted conditions