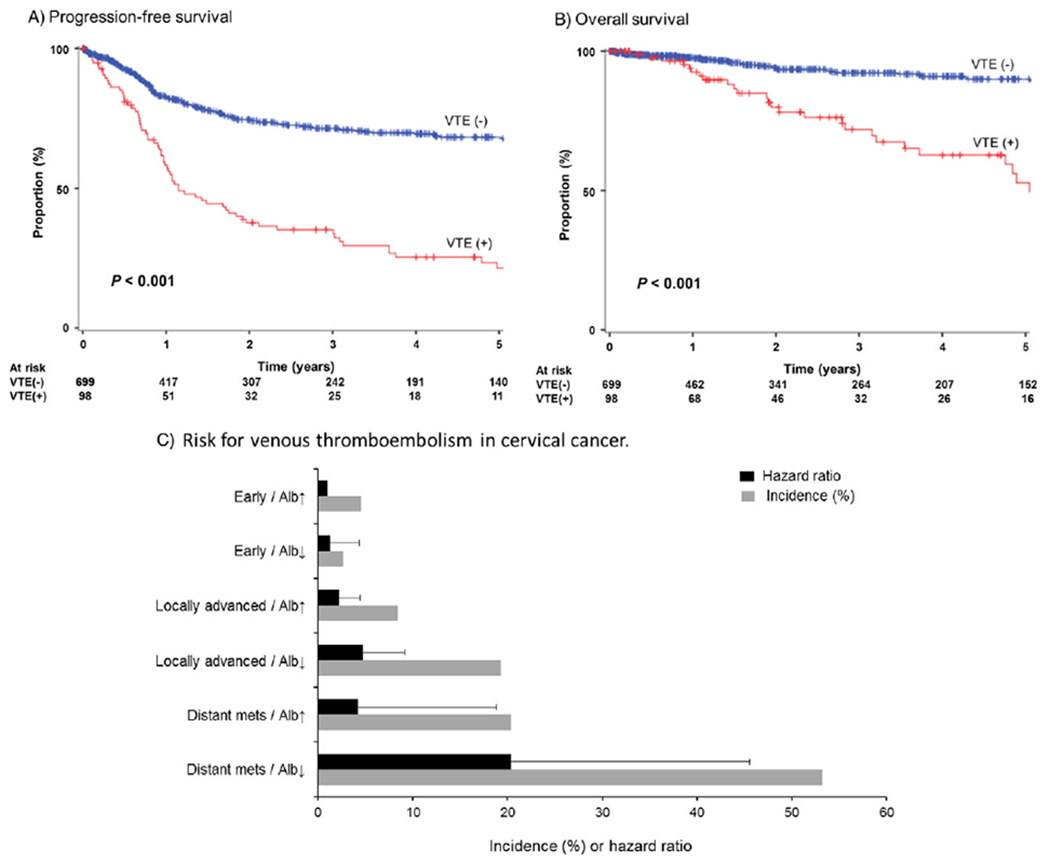
Fig. 2.

Survival curves and cumulative risk of venous thromboembolism. Log-rank test for P-value. (A) Progression-free survival stratified by VTE. (B) Disease-specific overall survival stratified by VTE. (C) 2-year cumulative incidence and risk for VTE based on patient factor (albumin level) and tumor factor (cancer stage). Number at risk indicates patients who had recurrence, progression, or cervical cancer death in each time point period. Events for survival are shown as proportional downward changes in the Kaplan-Meier curves. Censored cases (active surveillance or lost to follow-up) are shown as vertical bars. Abbreviations: VTE, venous thromboembolism; Alb↓, albumin level < 4.0 g/dL at cervical cancer diagnosis; and Alb↑, albumin level ≥4.0 g/dL at cervical cancer diagnosis.
