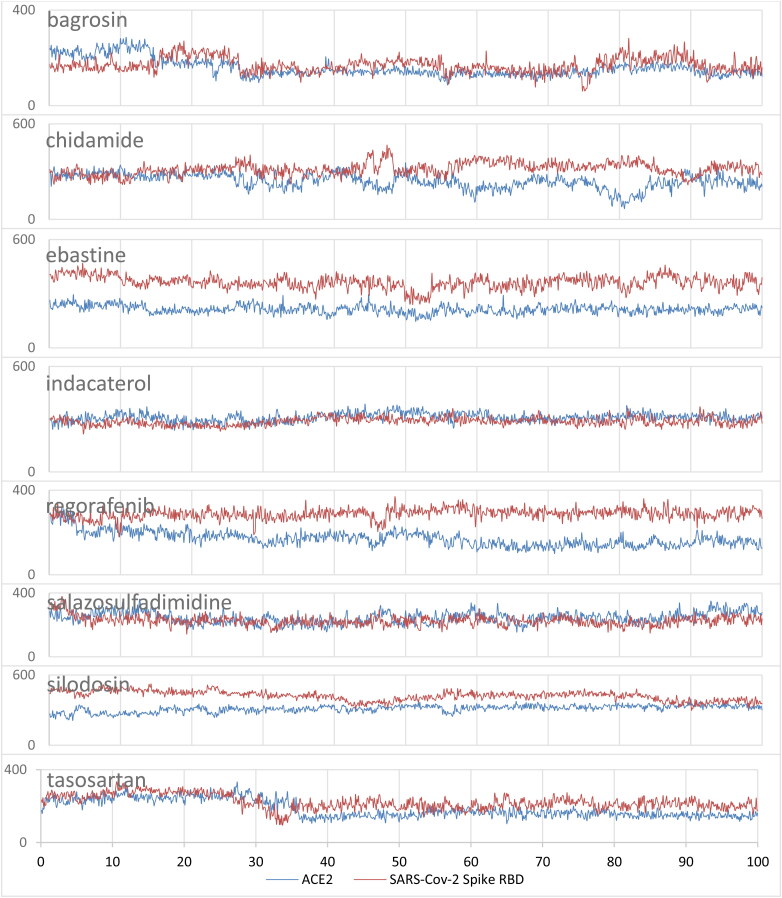
Figure 7.
Contact surface area (Å2) for a) bagrosin, b) chidamide, c) ebastine, d) indacaterol, e) regorafenib, f) salazosulfadimidine, g) silodosin and h) tasosartan with ACE2 and SARS-Cov-2 spike RBD. The blue represents the contact area with ACE2, and red color represents the contact area with SARS-Cov-2 spike RDB.

