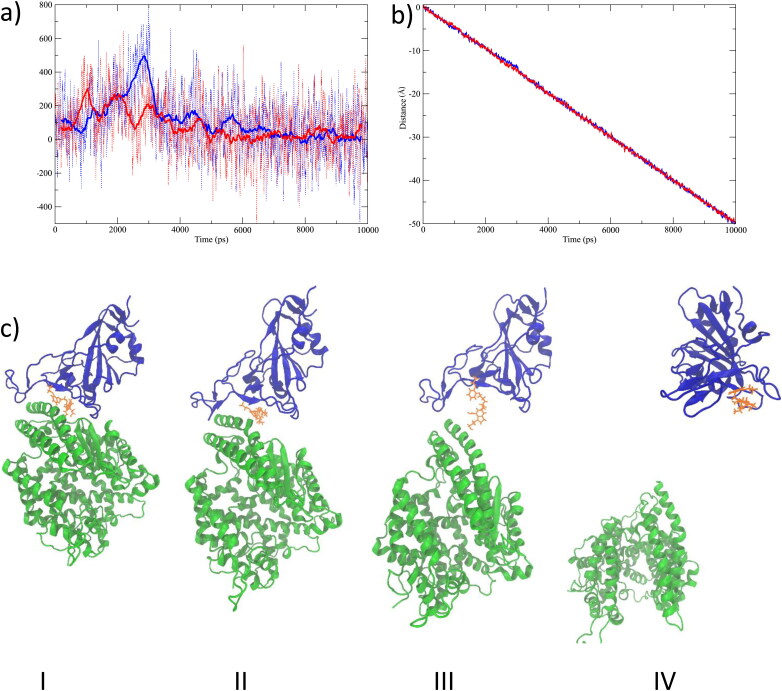
Figure 8.
SMD results as applied to ACE2 of the 6LZG protein and in the presence of the silodosin ligand. a) The dash lines represent the force vs. time for the SMD simulations, and the continuous lines represent the running average of the force vs. time taken over 50 ps windows. The blue lines show the 6LZG protein without ligand, and red lines show the 6LZG protein in the presence of silodosin. b) Position of center of mass of ACE2 during the SMD simulations. c) Snapshots during the SMD simulations at I) 0 ps, II) 2200 ps, III) 4000 ps and IV) 10000 ps. The blue new-cartoon represents SARS-CoV-2 S RBD, the green new-cartoon represents the ACE2 receptor, and the yellow molecule represents silodosin.

