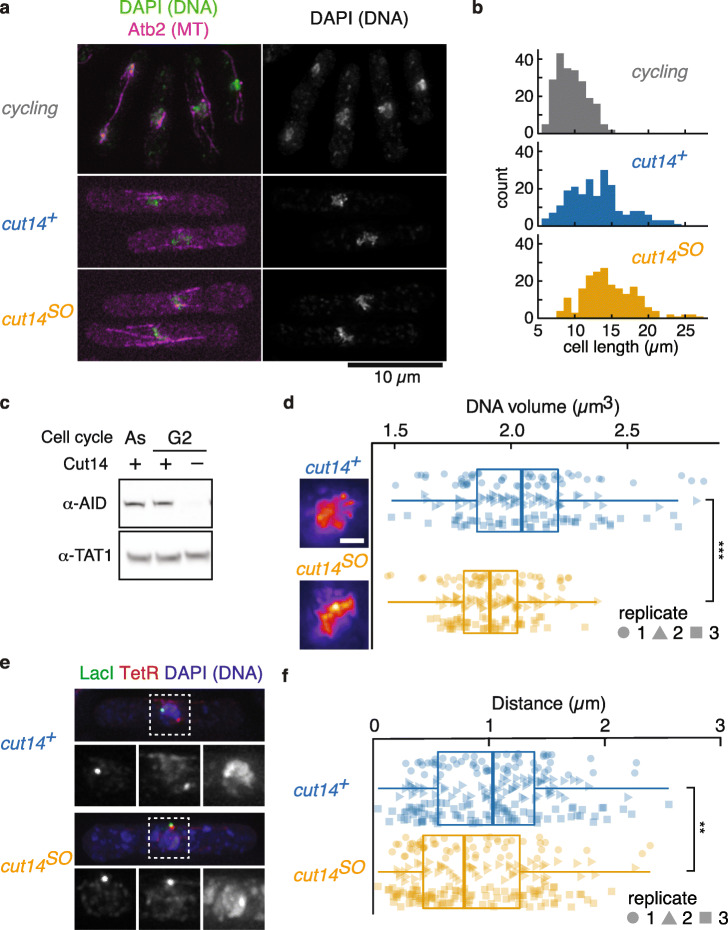
Fig. 1.
Condensin depletion causes loss of chromatin integrity in interphase. a Typical fluorescent images of exponentially growing (cycling) and G2-arrested cells in the presence (cut14+) or absence (cut14SO) of condensin. DNA, stained by DAPI, and mCherry-Atb2 (microtubules) are shown in green and magenta, respectively. Scale bar is 10 μm. b Distribution of cell lengths in cycling cells or following G2 arrest in cut14+ and cut14SO strains (median cell lengths were as follows: cycling cells 9.7 μm, G2-arrested cut14+ cells 12.9 μm, and G2-arrested cut14SO cells 14.3 μm). c Condensin depletion in G2-arrested cells was confirmed by western blotting. As, asynchronous cell culture; G2, cells arrested in G2 phase by 1NM-PP1. Cut14-AID was detected by α-AID antibody. α-TAT1 served as a loading control. d DNA volume quantified by DAPI staining. Boxplot of DNA volume in cut14+ control cells and following Cut14 depletion (cut14SO). Data from three biological replicates, identified by their distinct shapes, is compiled in one boxplot. ***p = 7.6 × 10⁻⁸. Pseudocolor images of DAPI-stained DNA in cut14+ and cut14SO are shown as reference. Scale bar is 1 μm. e Typical images of chromosomal distance, visualized by LacI-GFP at the lys1 locus (green, bottom left) and TetR-tdTomato at 1.95 Mb on chromosome I (red, bottom middle) in cut14+ and cut14SO. DNA stained by DAPI is shown in blue (bottom right). f Chromosomal distances in cut14+ and cut14SO cells are displayed as in d. **p = 0.0012

