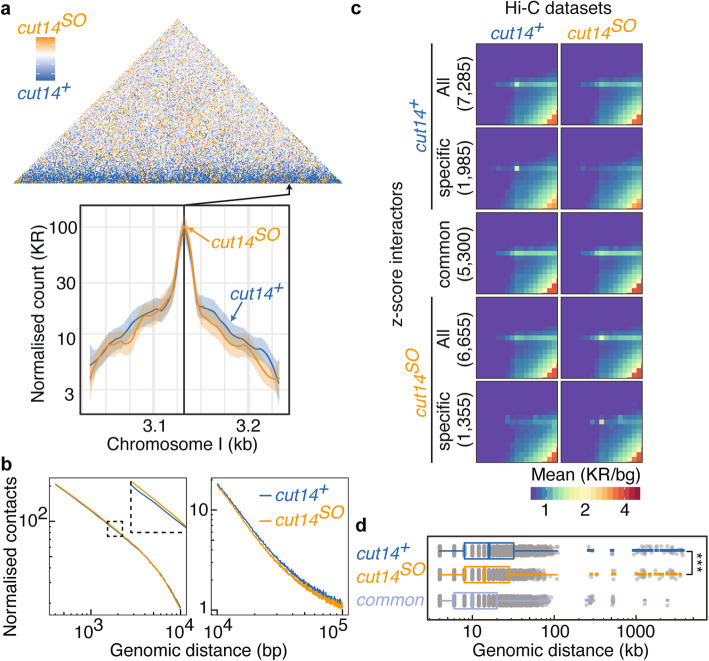
Fig. 3.
Hi-C reveals condensin-dependent chromatin interactions. a Hi-C difference map of the chromosome I left arm comparing cut14+ and cut14SO cells, as well as virtual 4C plots around the indicated viewpoint. Solid lines and shaded areas represent Loess-smoothed Hi-C contacts and 95% confidence intervals, respectively. b Contact probability as a function of genomic distance along the chromosome I left arm in cut14+ and cut14SO cells. c Aggregate Hi-C matrices of high z-score interactions in the indicated conditions. All, all interactions identified in either cut14+ or cut14SO cells; specific, interactions seen only in one of the two conditions; common, interactions identified in both conditions. Numbers of interactions are shown in brackets. d Genomic distances of high z-score interactions plotted as boxplots. ***p = 0.0002

