Fig. 4.

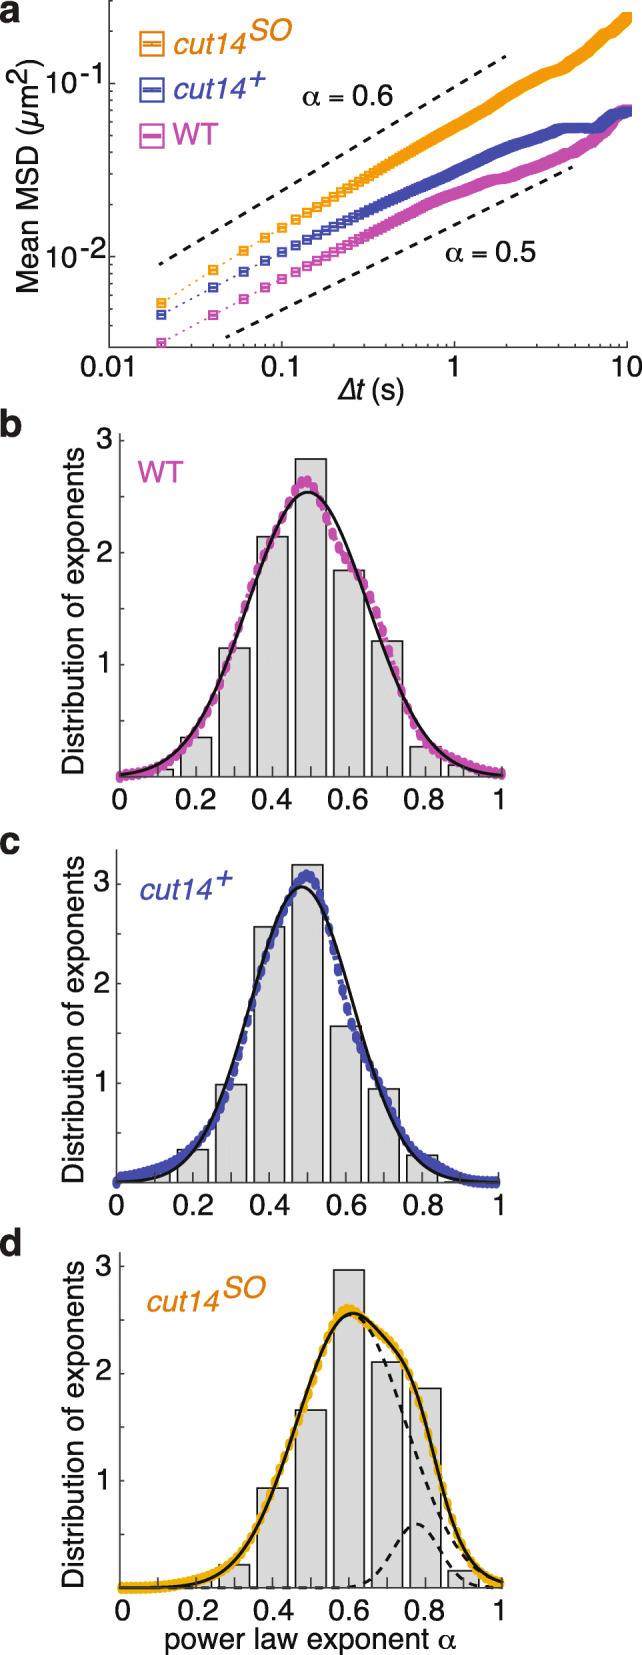
Condensin confines chromatin mobility in interphase. a MSD of chromatin mobility in wild type (WT), control (cut14+), and following condensin depletion (cut14SO). Weighted mean (dotted line) and standard error (square boxes) are shown. Black dotted lines above and below mean MSD are the slopes corresponding to 0.6 and 0.5, respectively. b–d Histogram (gray bars) and kernel density estimate (colored circles) of probability density of individual MSD exponents in G2-arrested WT (b), cut14+ (c), and cut14SO (d) cells. Solid lines are single Gaussian fit in case of WT and cut14+ and a double Gaussian fit for cut14SO cells. The dotted lines show the two component Gaussians (n > 300)
