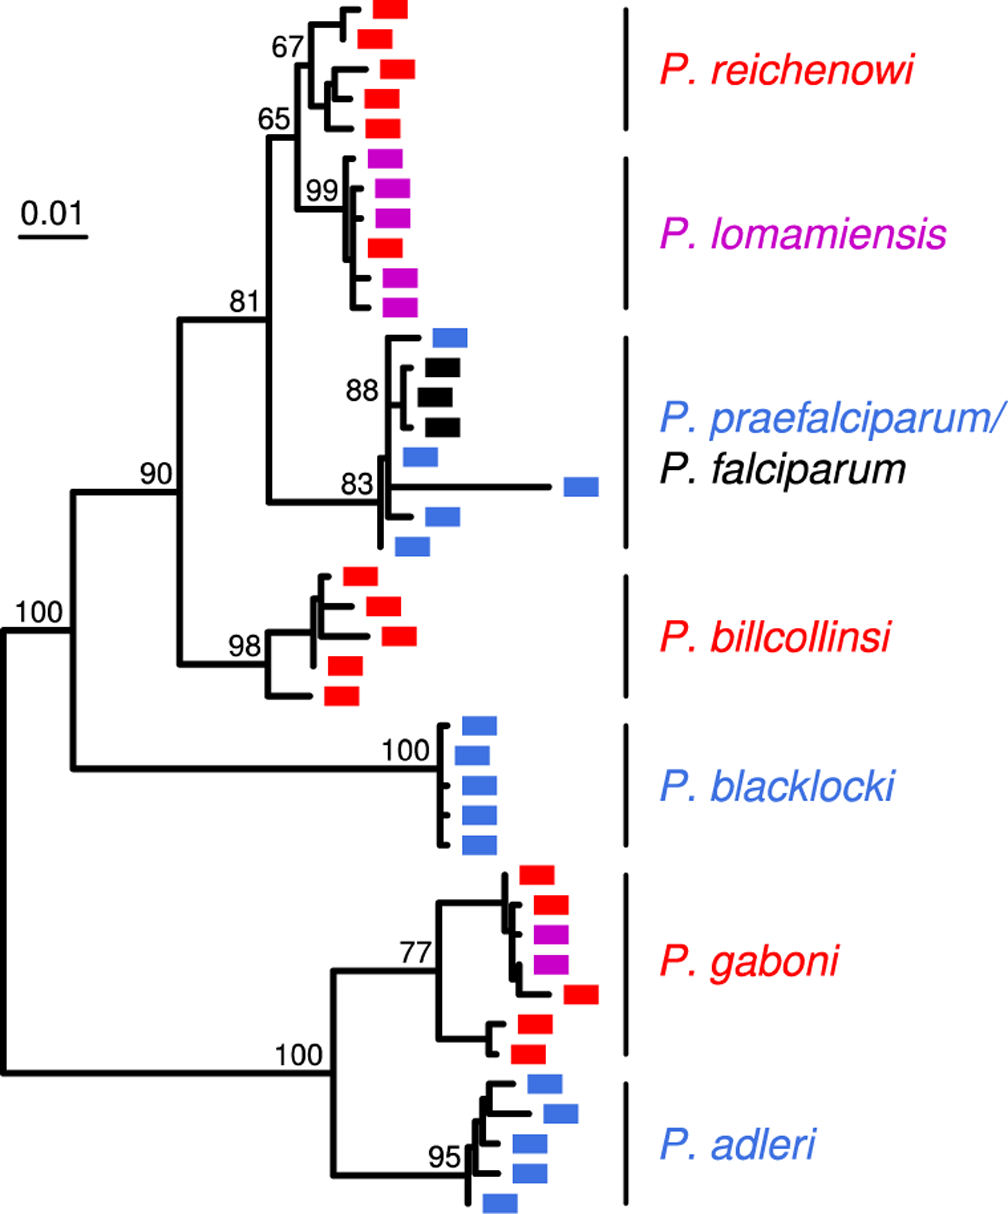
Figure 3.

Evolutionary relationships of Laverania species. A maximum likelihood tree (midpoint rooted) of mitochondrial (cytb) parasite sequences (956 bp) from chimpanzee (red), gorilla (blue), bonobo (purple) and human (black) samples is shown. Sequences were selected from published data (63–64, 66, 70, 72–73, 94, 124) to illustrate the diversity within each species (percent bootstrap values are shown for inter-species branches). The scale bar indicates nucleotide substitutions per site.
