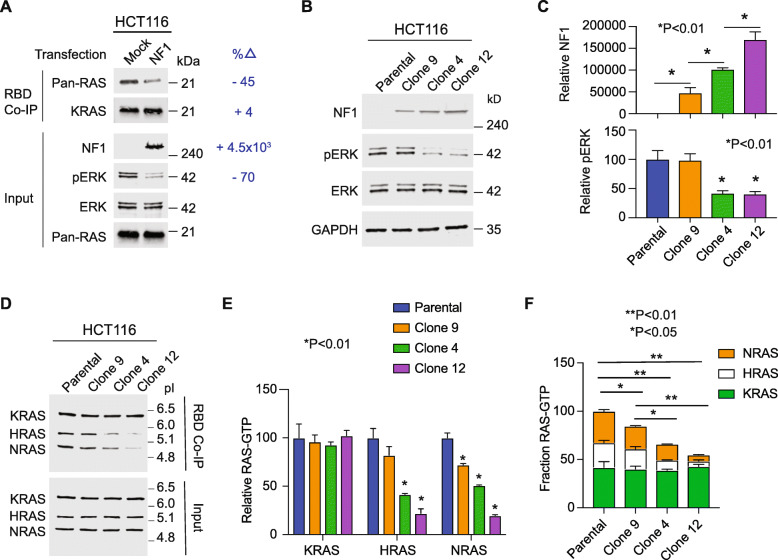
Fig. 1.
Evaluation of NF1 mediated hydrolysis of mutant and WT RAS. a Active Ras RBD pull down assays were performed on HCT-116 cells transfected to overexpress NF1. n = 1. b Immunoblots of HCT-116 clones that overexpress NF1 (left). n = 3. c Densitometry-based quantification of immunoblots, with means +/− SD, from three independent assays represented in (b). d RAS-GTP levels as measured by RBD pull-down followed by IEF to separate KRAS, HRAS, and NRAS in accordance with the isoelectric point (pI) of each. n = 3. e Densitometry based quantification of immunoblots, with means +/− SD, from three independent assays represented in (d). f Densitometry data from E, normalized to total RAS in the parental line. Indicated P-values are from One Way Anova followed by post-hoc Tukey’s test for multiple comparisons

