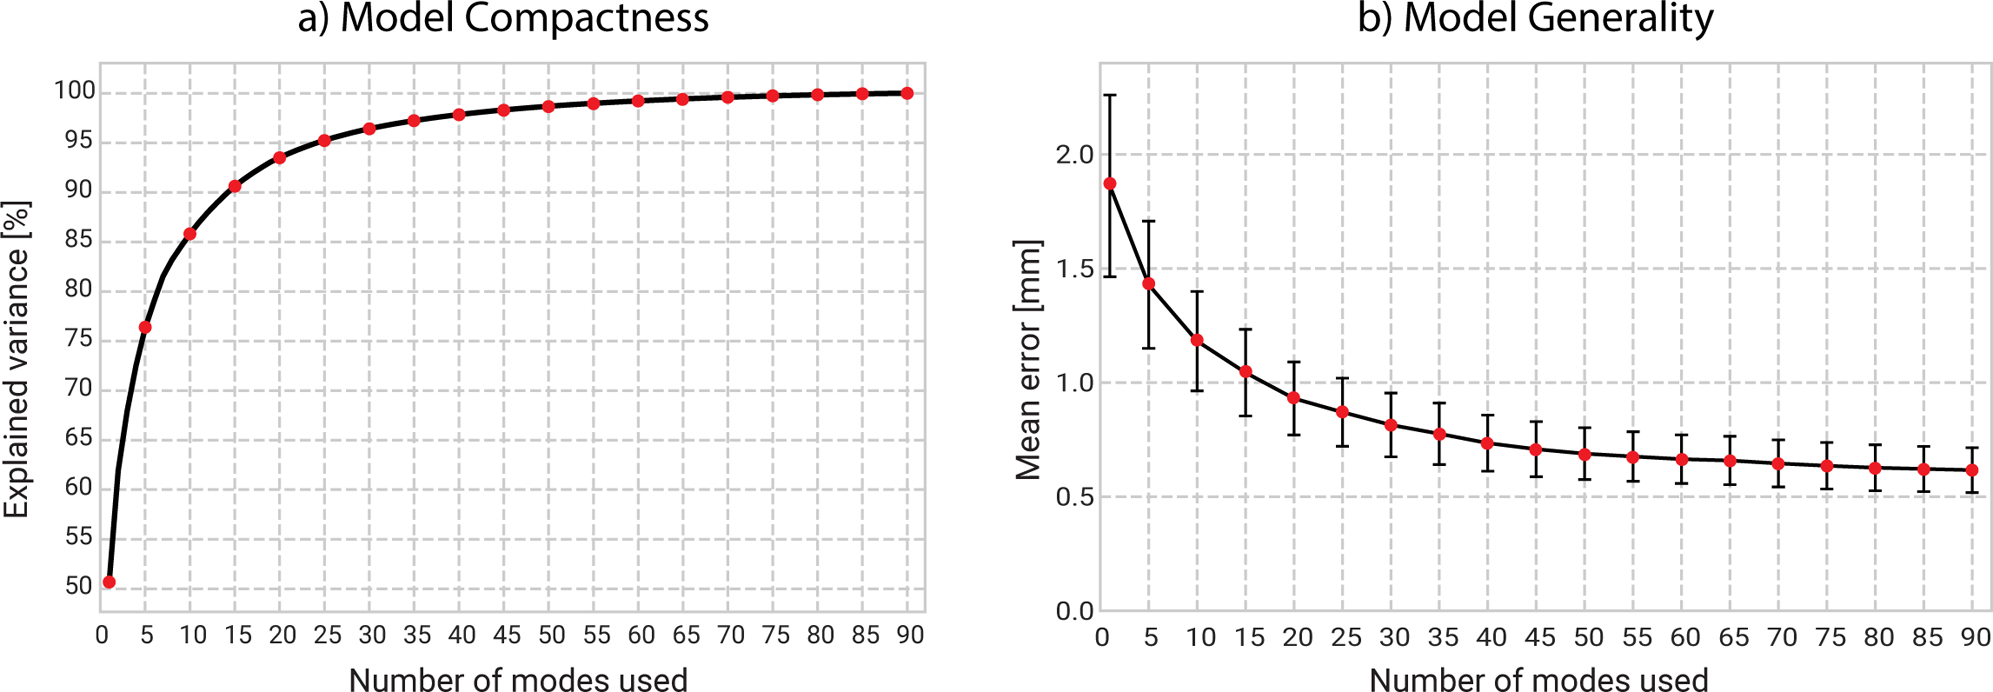
Figure 3.

Model performance is evaluated using its compactness (a) and generality (b) measurements. The first five modes account for approximately 75 % of the total variation. The generality graph snows that unlearned samples are able to be explained with an average error of 0.62 mm.
