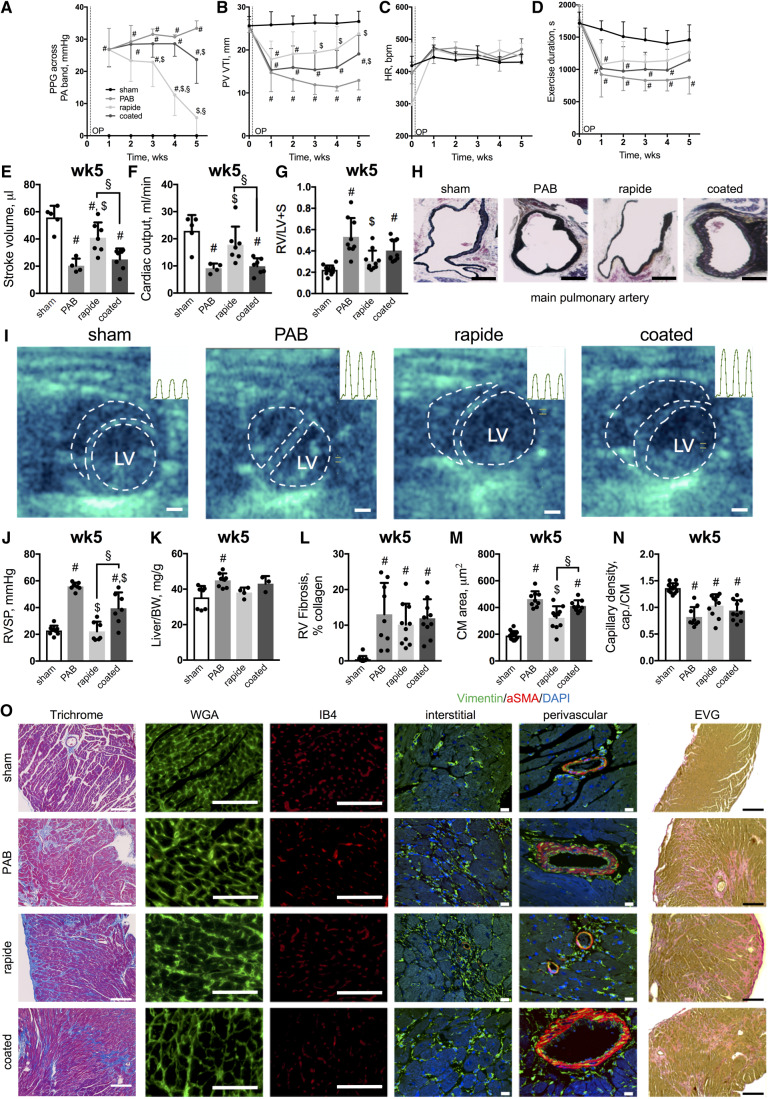
Figure 2.
Gradual de-PAB improves RV function and reverses RV hypertrophy. PPG measures across the pulmonary artery band (mmHg, A), PV VTI (B), heart rate (C), exercise duration (D), stroke volume (E) (n = 4–7), cardiac output (F; n = 4–7), and Fulton’s index (G). Representative images of the main pulmonary artery (Russel–Movat–Pentachrome stain, H) (scale bar: 500μm) and echocardiograms at 5 weeks after surgery—dashed lines indicating RV and LV chamber cavity—with intra-cardiac RV pressure traces for three cardiac cycles (inlays, I) (scale bar = 1 mm). RVSP (J) and Liver-to-bodyweight ratio (K) (n = 3–8). Quantifications of RV fibrosis (L), cardiomyocyte (CM) area (M) and capillary density (capillaries to cardiomyocytes, N) with representative images for Masson’s Trichrome, WGA, IB4, and elastic van Giesson stains (scale bar = 100μm) as well as immunolabelling of Vimentin and aSMA (scale bar = 10μm) (O). n = 3–15 animals per group and timepoint. (Repeated measure) Two-way or one-way ANOVA followed by Tukey’s multiple comparison post hoc test was performed. #P < 0.05 vs. sham; $P < 0.05 vs. PAB; §P < 0.05 rapide vs. coated.

