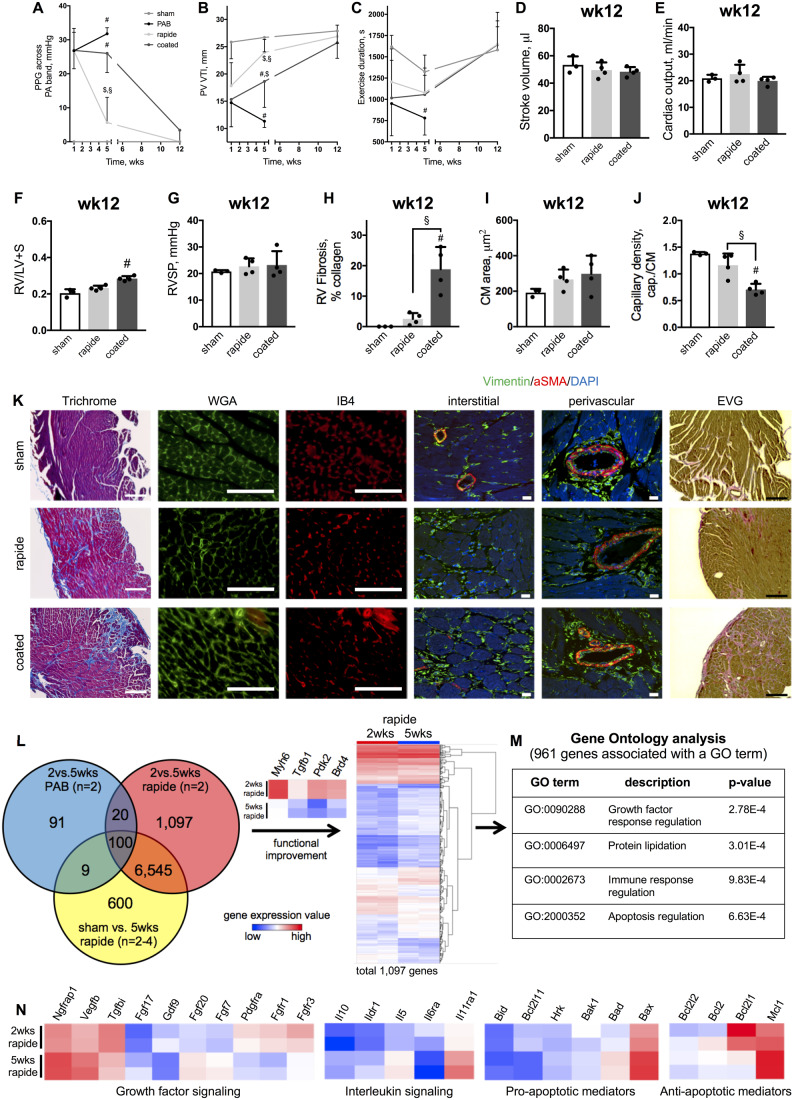
Figure 3.
RV dysfunction is fully reversible with hypertrophic preceding fibrotic and vascular reverse-remodelling after gradual de-PAB. PPG across the pulmonary artery band (A), PV VTI (B), and exercise duration (C) over 12 weeks. Stroke volume (D), cardiac output (E), and Fulton’s index (F) with RV systolic pressure (G). Quantifications of RV fibrosis (H), CM area (I), and capillary density (capillaries to cardiomyocytes, J) with representative images for Masson’s Trichrome, WGA, IB4, and elastic van Giesson stains (scale bar = 100μm) as well as immunolabelling of Vimentin and aSMA (scale bar = 10μm) (K). Venn diagram showing differentially regulated genes (P < 0.05, fold change < −2 or >2) for each possible comparison and a heat map of gene expression values (log2) for differentially regulated genes when comparing PAB with 2 vs. 5 weeks rapide sutures. Genes associated with cardiac remodelling (Myh6, Tgfb1, Pdk2, and Brd4) are highlighted (L). GO analysis of 1097 genes underlying functional improvement, whereof 961 genes were associated with GO terms (M). Relative expression of selected differentially regulated genes associated with the indicated cellular processes (N). n = 3–4 animals for each group at the 12-week timepoint, n = 2 animals underwent gene array analysis. Repeated measures two-way or one-way ANOVA followed by Tukey’s multiple comparison post hoc test was performed. #P < 0.05 vs. sham; §P < 0.05 rapide vs. coated. Heatmaps: blue—low expression value; red—high expression value.

