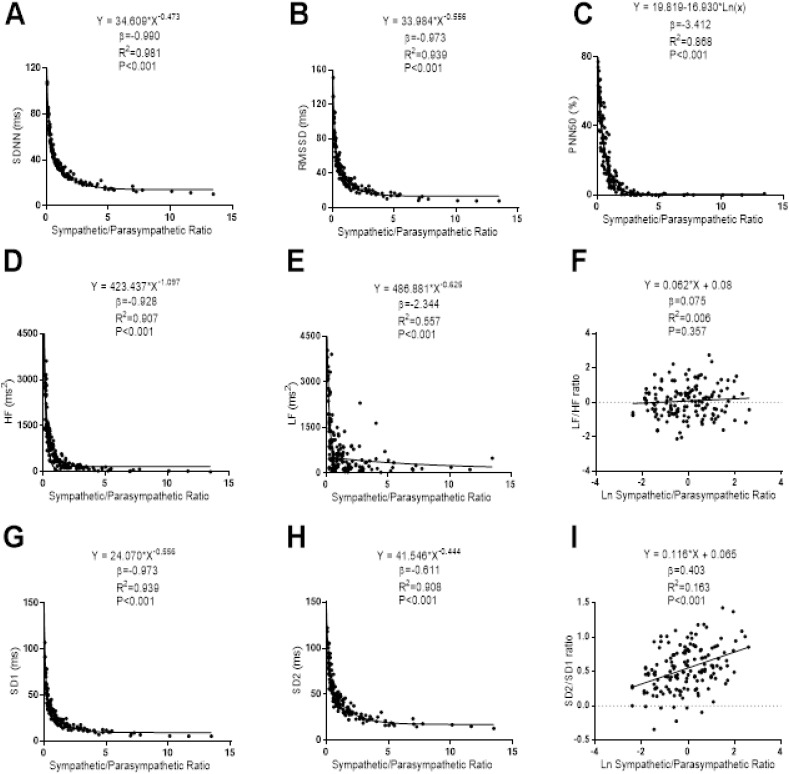
Figure 4. Association between stress score and SDNN (A), RMSSD (B), PNN50 (C), high frequency (D), low frequency (E), ratio low–high frequency (F), SD1 (G), SD2 (H) and ratio SD2/SD1 (I).
β (standardized regression coefficient), R2 (determination coefficient) and P (level of significance) from simple linear regression and non-linear regression analysis respectively. Abbreviations: SDNN, standard deviation of RR intervals; RMSSD, root mean square of successive differences; PNN50, percentage of successive intervals that differs more than 50 ms; SD1, standard deviation of Poincare plot orthogonal to the line-of-identity; SD2, standard deviation of Poincare plot along the line-of-identity; ms, milliseconds; %, percentage and ms2, milliseconds square; Ln, Napierian logarithm.

