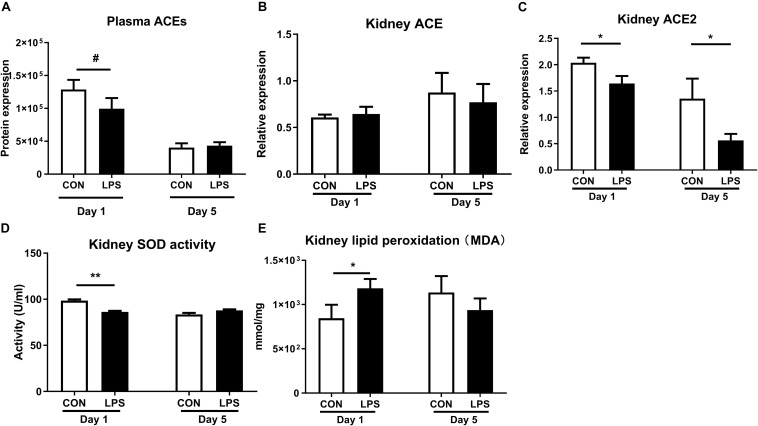
FIGURE 6.
Effects of IA LPS on the renal renin-angiotensin system and generation of reactive oxygen species. (A) Protein levels of ACEs in plasma. (B,C) mRNA levels of ACE and ACE2 in kidney tissues. (D) SOD activity in kidney tissue. (E) Lipid peroxidation (malondialdehyde, MDA) level in kidney tissue. Data are presented as mean ± SEM. *q or p < 0.05 and **q or p < 0.01. ACE, angiotensin-converting enzyme; SOD, superoxide dismutase.

