. 2020 May 11;44(5):747–763. doi: 10.4093/dmj.2019.0124

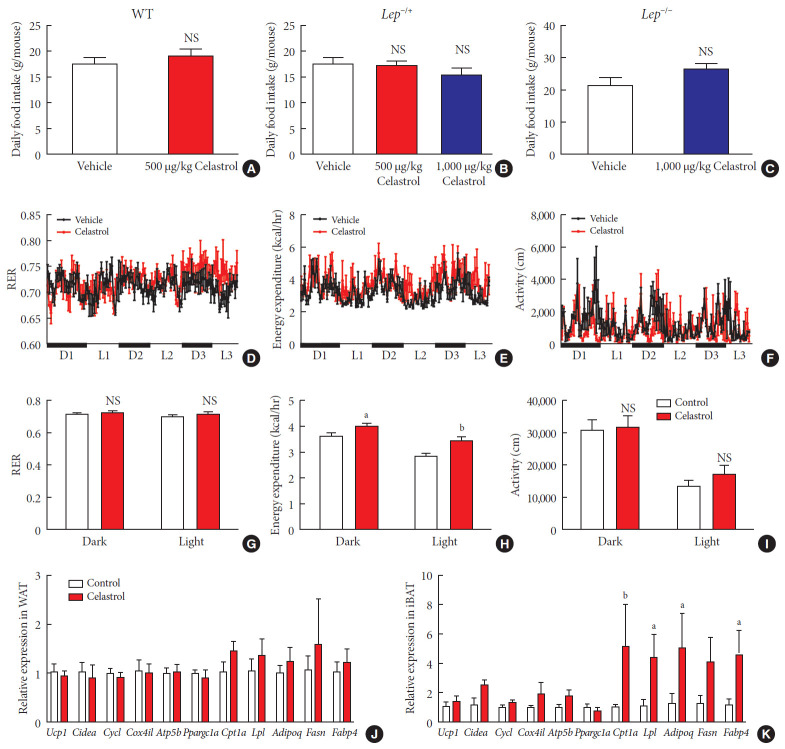
Fig. 5. Celastrol regulates energy homeostasis by enhancing energy expenditure (EE). (A–C) The average daily food intake of the (A) wild-type (WT), (B) Lep−/+, and (C) Lep−/− diet-induced obese (DIO) rats during the 3 weeks of treatment. (D-K) The WT DIO rats were placed in TSE Labmaster Caging System metabolic cages and administered vehicle or 500 µg/kg celastrol for 3 days after 1 week of celastrol acclimation (n=3 for each group). The dynamic or cycle-summarized (D, G) respiratory exchange ratios (RERs), (E, H) EE, and (F, I) the level of physical activity of each group of rats. (J, K) The mRNA expression of genes that participate in adipogenesis and fatty acid metabolism pathways in (J) white adipose tissue (WAT) and (K) brown adipose tissue (BAT). The error bars represent the standard error of means. (A-C and G-K) The P values were determined by Student's t-test. NS, not significant. aP<0.05, bP<0.01.

Fig. 5