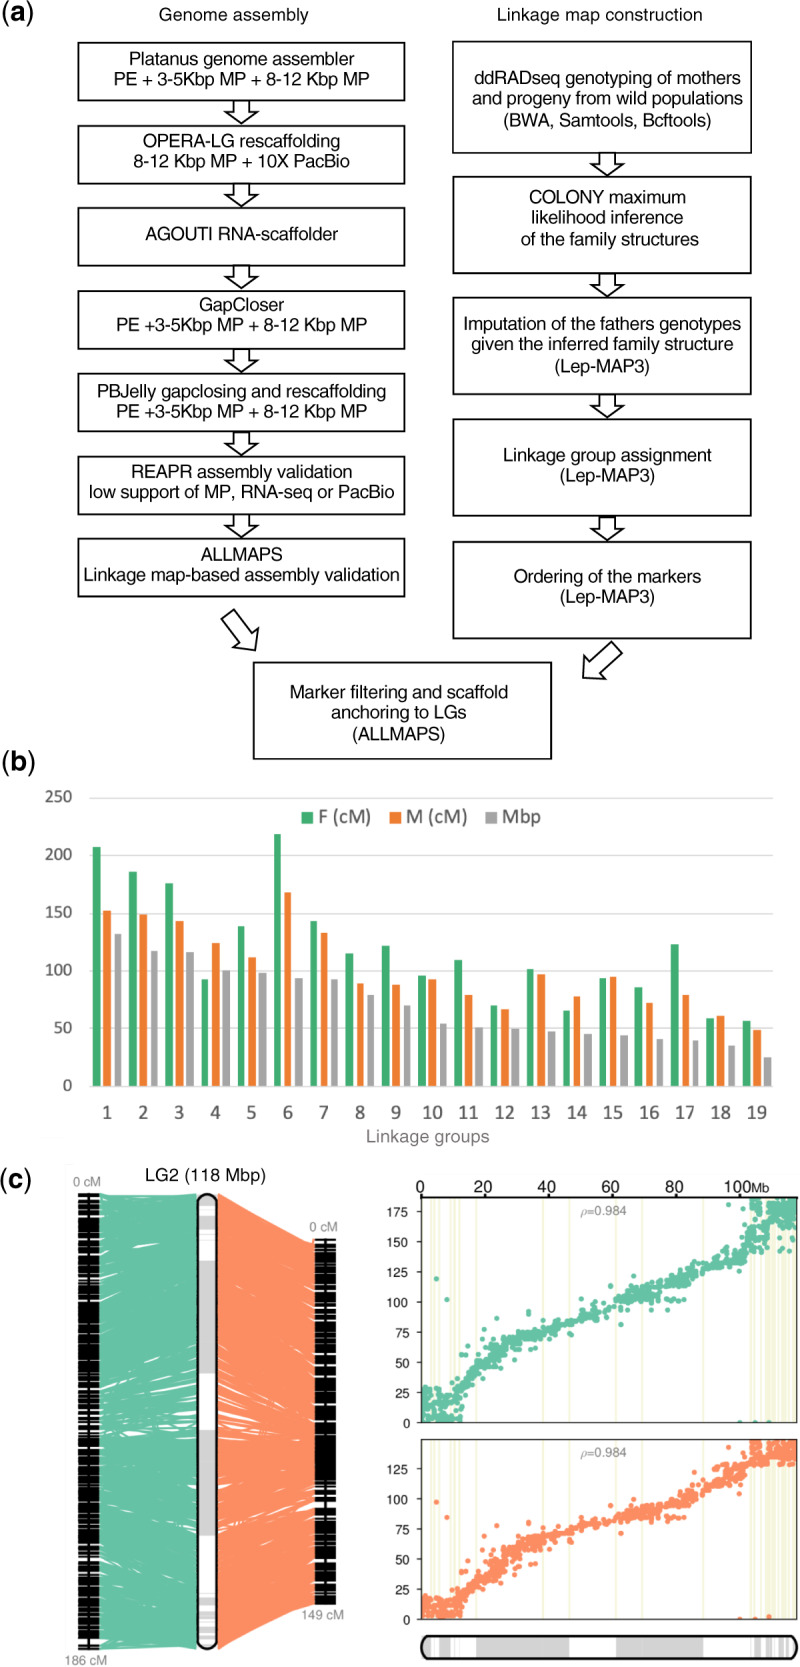
Fig. 1.

The genome assembly and linkage map construction for the common lizard, Zootoca vivipara. (a) The genome assembly and linkage map generation pipelines used in the study. (b) The length of the male (M), female (F), and consensus linkage groups. (c) An example of Linkage Group 2 based on the male (orange) and female (green) genetic maps. Pearson correlation coefficients between the physical (X axis) and genetic (Y axis) distances are indicated. Gray and white bars represent scaffolds.
