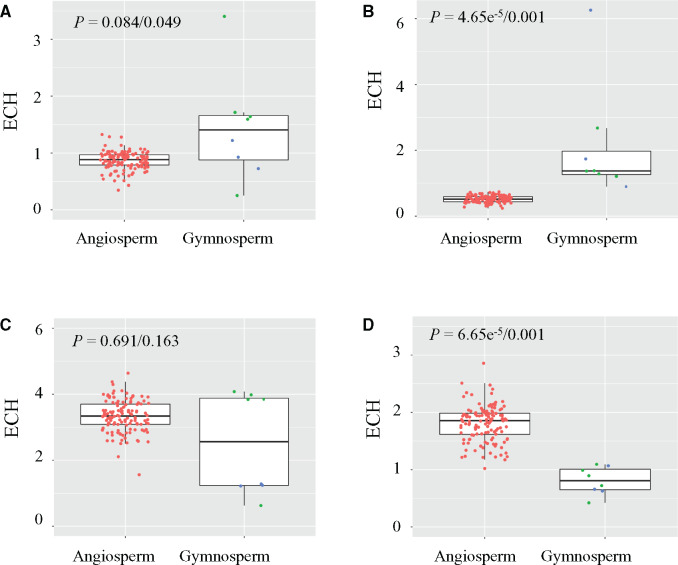
Fig. 3.
Differential enrichment of microhomologies in mitogenomes of angiosperms, gymnosperms, and conifers. (A) Microhomology “TAAAGGT” (TAG7); (B) “ATATACG”; (C) “AGCAAGC”; (D) microhomology “AGTCTTC.” Each red, green, and blue dot represents a representative angiosperm, conifer, and nonconifer gymnosperm, respectively. P values of Mann Whitney U tests after Benjamini–Hochberg correction for ECH values of angiosperm vs. gymnosperm and angiosperm vs. conifer are shown in each boxplot. The top, middle, and bottom horizontal lines in each boxplot indicate the first quartile, median, and third quartile, respectively.

