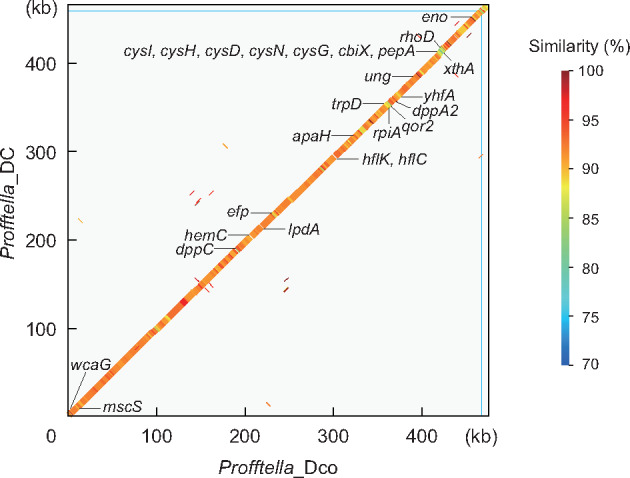
Fig. 1.

Comparison of the genomic structures of Profftella_Dco and Profftella_DC. The genomes of Profftella_Dco and Profftella_DC are represented by the x and y axes, respectively. The thick line indicates the shared synteny between the two genomes. The color of the line indicates the percentage similarity between the nucleotide sequences. For each genome, the chromosome and the plasmid were concatenated, the borders of which are indicated by thin blue lines. The genes found in Profftella_Dco, but not in Profftella_DC, are presented below the line plot; the genes present in Profftella_DC, but not in Profftella_Dco, are shown above the line plot.
