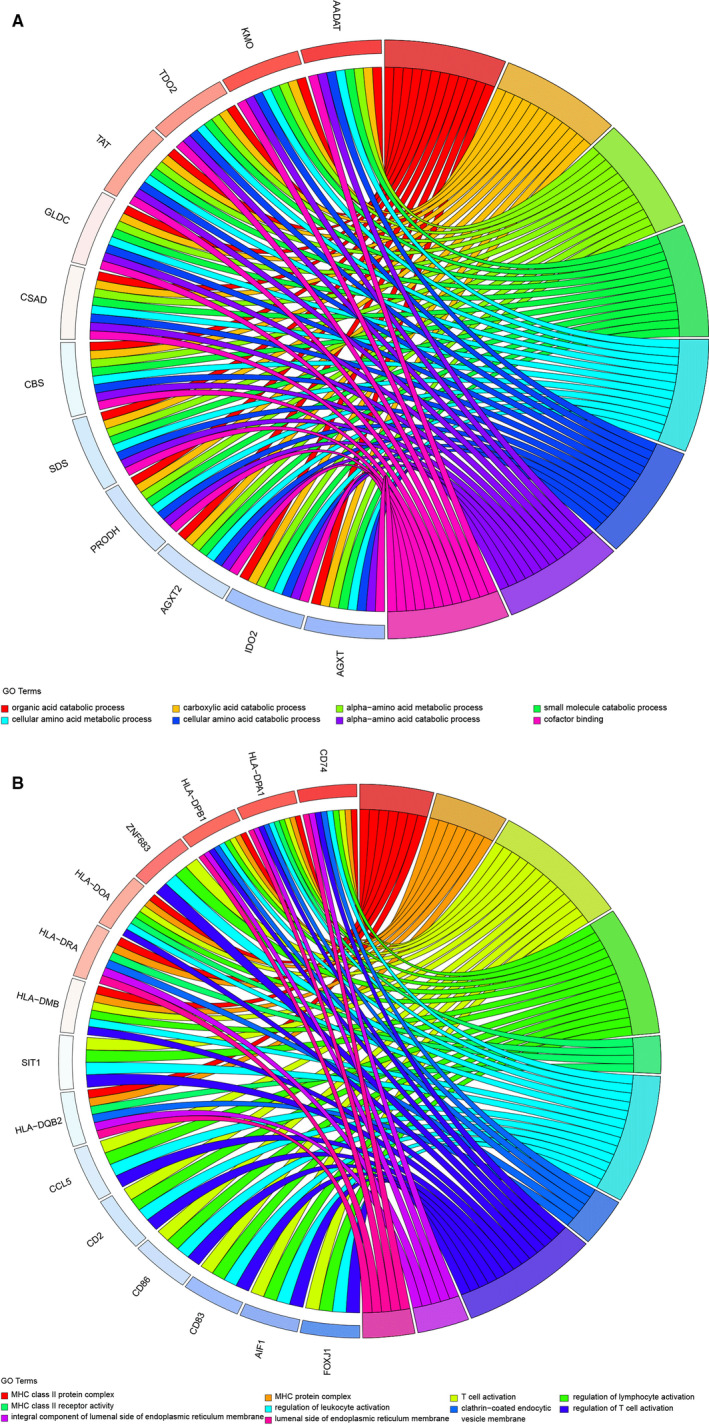
FIGURE 5.

GO analysis based on the intersection genes. A, Chord plot of the 597 intersection genes from MAOA positively related co‐expressed genes (CEGs) and downregulated differentially expressed genes (DEGs). B, Chord plot of the 184 intersection genes of MAOA negatively related CEGs and upregulated DEGs. GO, Gene Ontology
