FIGURE 3.

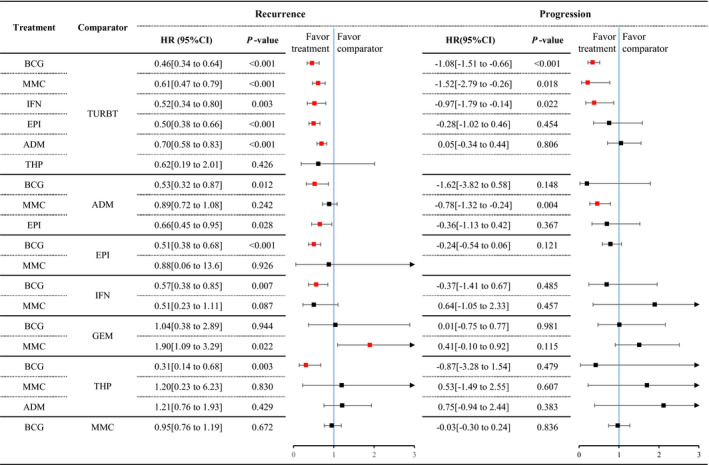
Forest plot of pairwise meta‐analysis. Red point of effect size indicates that the difference of the comparison is significant

Forest plot of pairwise meta‐analysis. Red point of effect size indicates that the difference of the comparison is significant