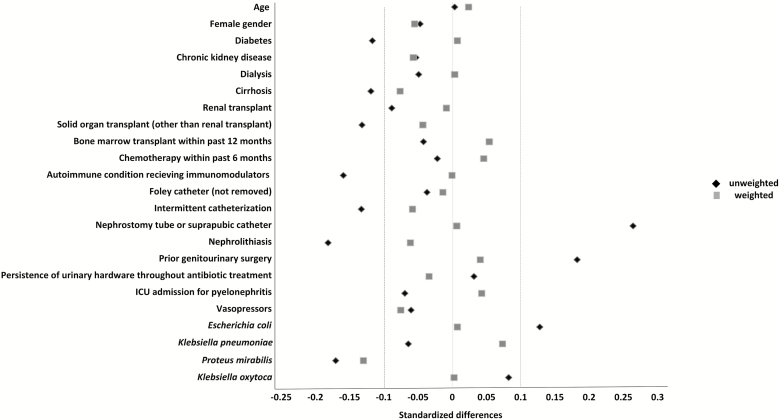
Figure 1.
Standardized mean differences comparing the full, unweighted cohort and the propensity score–weighted cohort after inverse probability of treatment weighting in a study of 188 adults with ESBL-producing Enterobacterales pyelonephritis. The dotted vertical lines represent standardized mean differences at −0.10 and 0.10, with the gray squares inside this range representing an adequate variable balance in the weighted cohort. Abbreviations: ESBL, extended-spectrum β-lactamase; ICU, intensive care unit.

