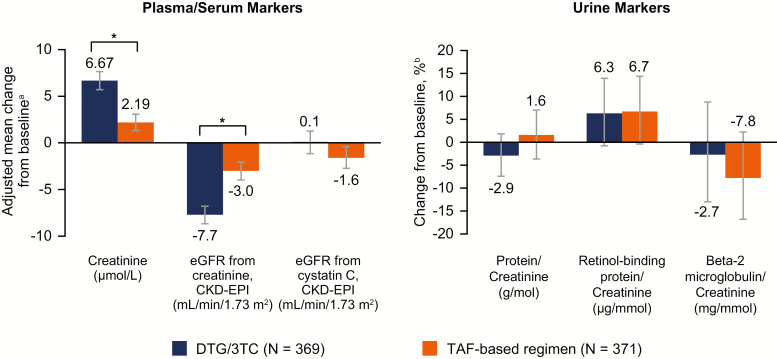
Figure 5.
Change from baseline at week 48 in renal biomarkers. aEstimated mean change from baseline at week 48 in each group calculated from mixed model repeated measures adjusting for treatment, visit, baseline third agent class, CD4+ cell count (continuous), age (continuous), sex, race, body mass index (continuous), presence of diabetes mellitus, presence of hypertension, baseline biomarker (continuous), treatment-by-visit interaction, and baseline value-by-visit interaction, with visit as the repeated factor. bBased on estimated geometric means ratio of week 48 vs baseline. Based on the same model as plasma/serum markers except adjusting for loge-transformed baseline biomarker (continuous). *P < .001. Abbreviations: 3TC, lamivudine; CKD-EPI, Chronic Kidney Disease Epidemiology Collaboration equation; DTG, dolutegravir; eGFR, estimated glomerular filtration rate; TAF, tenofovir alafenamide.

